Immigrants from Eastern Europe vs Immigrants from Central America Householder Income Ages 25 - 44 years
COMPARE
Immigrants from Eastern Europe
Immigrants from Central America
Householder Income Ages 25 - 44 years
Householder Income Ages 25 - 44 years Comparison
Immigrants from Eastern Europe
Immigrants from Central America
$104,662
HOUSEHOLDER INCOME AGES 25 - 44 YEARS
99.6/ 100
METRIC RATING
68th/ 347
METRIC RANK
$80,012
HOUSEHOLDER INCOME AGES 25 - 44 YEARS
0.0/ 100
METRIC RATING
308th/ 347
METRIC RANK
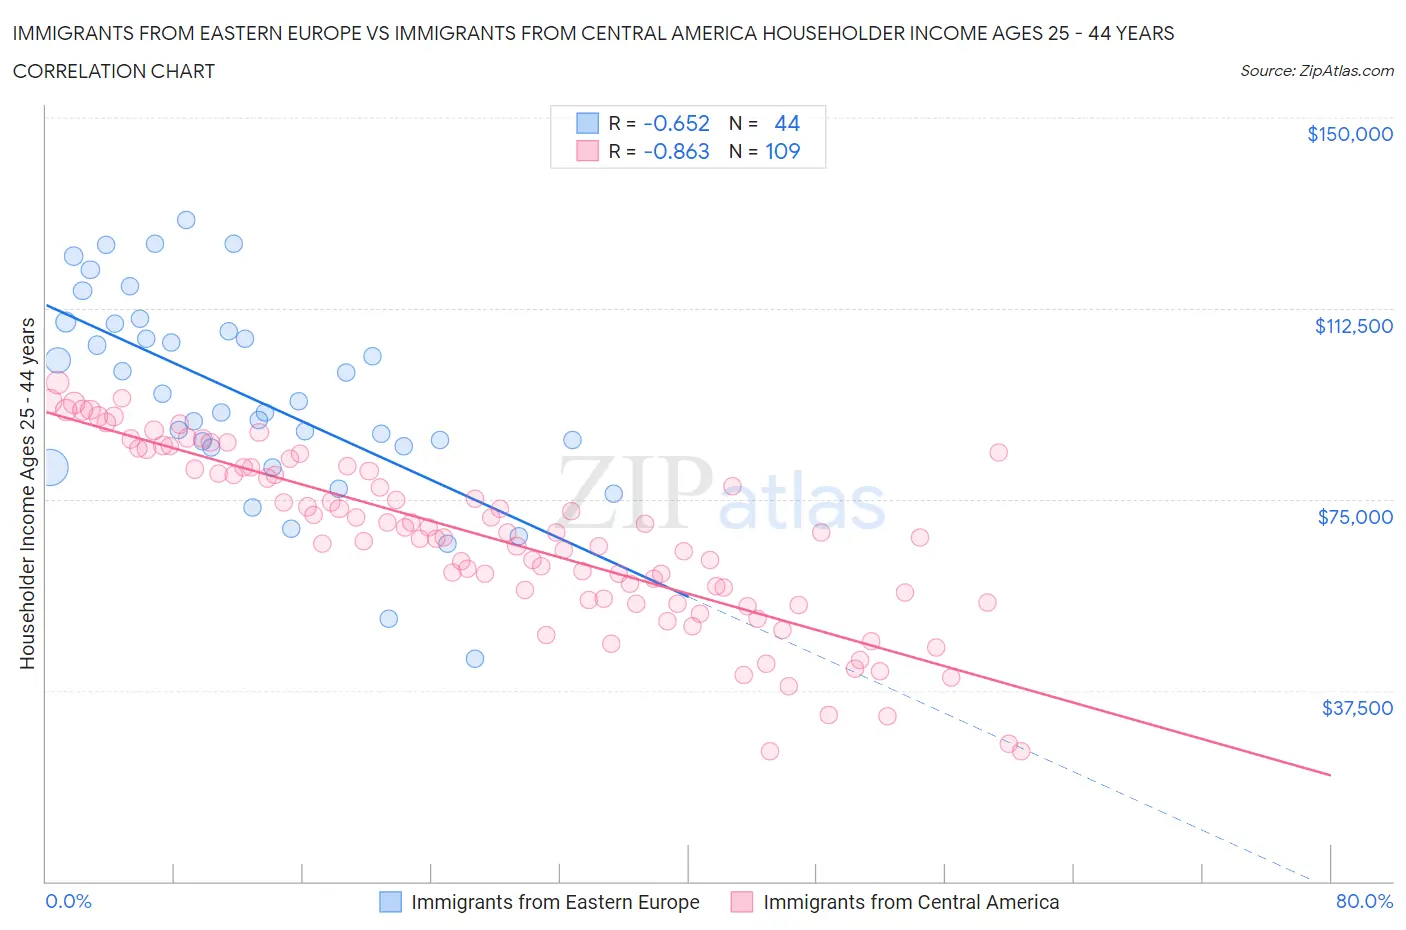
Immigrants from Eastern Europe vs Immigrants from Central America Householder Income Ages 25 - 44 years Correlation Chart
The statistical analysis conducted on geographies consisting of 473,985,258 people shows a significant negative correlation between the proportion of Immigrants from Eastern Europe and household income with householder between the ages 25 and 44 in the United States with a correlation coefficient (R) of -0.652 and weighted average of $104,662. Similarly, the statistical analysis conducted on geographies consisting of 532,829,838 people shows a very strong negative correlation between the proportion of Immigrants from Central America and household income with householder between the ages 25 and 44 in the United States with a correlation coefficient (R) of -0.863 and weighted average of $80,012, a difference of 30.8%.
Householder Income Ages 25 - 44 years Correlation Summary
| Measurement | Immigrants from Eastern Europe | Immigrants from Central America |
| Minimum | $43,724 | $25,500 |
| Maximum | $129,765 | $97,900 |
| Range | $86,041 | $72,400 |
| Mean | $95,165 | $67,406 |
| Median | $93,230 | $68,457 |
| Interquartile 25% (IQ1) | $85,360 | $55,448 |
| Interquartile 75% (IQ3) | $108,718 | $81,287 |
| Interquartile Range (IQR) | $23,358 | $25,840 |
| Standard Deviation (Sample) | $19,648 | $17,129 |
| Standard Deviation (Population) | $19,424 | $17,050 |
Similar Demographics by Householder Income Ages 25 - 44 years
Demographics Similar to Immigrants from Eastern Europe by Householder Income Ages 25 - 44 years
In terms of householder income ages 25 - 44 years, the demographic groups most similar to Immigrants from Eastern Europe are Immigrants from Romania ($104,713, a difference of 0.050%), Mongolian ($104,578, a difference of 0.080%), Immigrants from Croatia ($104,503, a difference of 0.15%), Afghan ($104,410, a difference of 0.24%), and Laotian ($104,993, a difference of 0.32%).
| Demographics | Rating | Rank | Householder Income Ages 25 - 44 years |
| Lithuanians | 99.7 /100 | #61 | Exceptional $105,223 |
| Immigrants | Italy | 99.7 /100 | #62 | Exceptional $105,201 |
| Immigrants | Scotland | 99.7 /100 | #63 | Exceptional $105,089 |
| New Zealanders | 99.7 /100 | #64 | Exceptional $105,085 |
| Immigrants | Netherlands | 99.7 /100 | #65 | Exceptional $105,082 |
| Laotians | 99.7 /100 | #66 | Exceptional $104,993 |
| Immigrants | Romania | 99.6 /100 | #67 | Exceptional $104,713 |
| Immigrants | Eastern Europe | 99.6 /100 | #68 | Exceptional $104,662 |
| Mongolians | 99.6 /100 | #69 | Exceptional $104,578 |
| Immigrants | Croatia | 99.6 /100 | #70 | Exceptional $104,503 |
| Afghans | 99.6 /100 | #71 | Exceptional $104,410 |
| Chinese | 99.5 /100 | #72 | Exceptional $104,264 |
| Italians | 99.5 /100 | #73 | Exceptional $104,215 |
| Immigrants | Fiji | 99.5 /100 | #74 | Exceptional $103,954 |
| Koreans | 99.4 /100 | #75 | Exceptional $103,824 |
Demographics Similar to Immigrants from Central America by Householder Income Ages 25 - 44 years
In terms of householder income ages 25 - 44 years, the demographic groups most similar to Immigrants from Central America are Chippewa ($80,005, a difference of 0.010%), Haitian ($80,055, a difference of 0.050%), Fijian ($79,956, a difference of 0.070%), Apache ($80,260, a difference of 0.31%), and Immigrants from Dominican Republic ($80,319, a difference of 0.38%).
| Demographics | Rating | Rank | Householder Income Ages 25 - 44 years |
| Immigrants | Micronesia | 0.0 /100 | #301 | Tragic $80,544 |
| Hispanics or Latinos | 0.0 /100 | #302 | Tragic $80,515 |
| Mexicans | 0.0 /100 | #303 | Tragic $80,427 |
| Immigrants | Caribbean | 0.0 /100 | #304 | Tragic $80,326 |
| Immigrants | Dominican Republic | 0.0 /100 | #305 | Tragic $80,319 |
| Apache | 0.0 /100 | #306 | Tragic $80,260 |
| Haitians | 0.0 /100 | #307 | Tragic $80,055 |
| Immigrants | Central America | 0.0 /100 | #308 | Tragic $80,012 |
| Chippewa | 0.0 /100 | #309 | Tragic $80,005 |
| Fijians | 0.0 /100 | #310 | Tragic $79,956 |
| Indonesians | 0.0 /100 | #311 | Tragic $79,543 |
| Immigrants | Haiti | 0.0 /100 | #312 | Tragic $79,391 |
| Menominee | 0.0 /100 | #313 | Tragic $79,358 |
| Cheyenne | 0.0 /100 | #314 | Tragic $79,152 |
| Ottawa | 0.0 /100 | #315 | Tragic $79,012 |