Welsh vs Immigrants from Central America Seniors Poverty Over the Age of 65
COMPARE
Welsh
Immigrants from Central America
Seniors Poverty Over the Age of 65
Seniors Poverty Over the Age of 65 Comparison
Welsh
Immigrants from Central America
9.3%
SENIORS POVERTY OVER THE AGE OF 65
99.9/ 100
METRIC RATING
23rd/ 347
METRIC RANK
13.6%
SENIORS POVERTY OVER THE AGE OF 65
0.0/ 100
METRIC RATING
290th/ 347
METRIC RANK
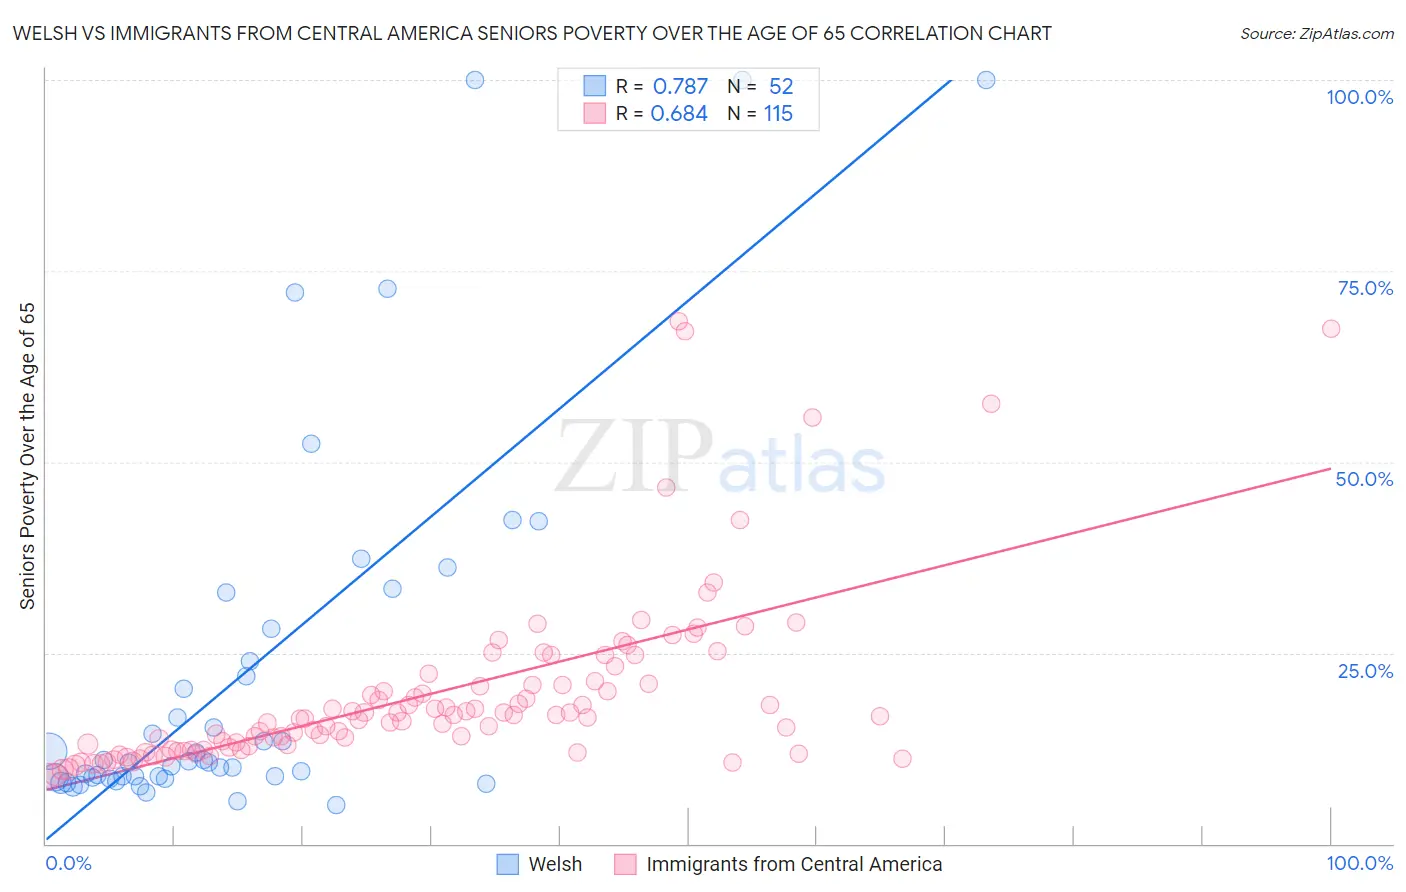
Welsh vs Immigrants from Central America Seniors Poverty Over the Age of 65 Correlation Chart
The statistical analysis conducted on geographies consisting of 524,701,906 people shows a strong positive correlation between the proportion of Welsh and poverty level among seniors over the age of 65 in the United States with a correlation coefficient (R) of 0.787 and weighted average of 9.3%. Similarly, the statistical analysis conducted on geographies consisting of 532,786,932 people shows a significant positive correlation between the proportion of Immigrants from Central America and poverty level among seniors over the age of 65 in the United States with a correlation coefficient (R) of 0.684 and weighted average of 13.6%, a difference of 47.4%.
Seniors Poverty Over the Age of 65 Correlation Summary
| Measurement | Welsh | Immigrants from Central America |
| Minimum | 5.0% | 8.9% |
| Maximum | 100.0% | 68.4% |
| Range | 95.0% | 59.5% |
| Mean | 22.4% | 19.6% |
| Median | 10.7% | 16.5% |
| Interquartile 25% (IQ1) | 8.7% | 12.3% |
| Interquartile 75% (IQ3) | 26.0% | 20.9% |
| Interquartile Range (IQR) | 17.3% | 8.6% |
| Standard Deviation (Sample) | 24.8% | 11.5% |
| Standard Deviation (Population) | 24.6% | 11.5% |
Similar Demographics by Seniors Poverty Over the Age of 65
Demographics Similar to Welsh by Seniors Poverty Over the Age of 65
In terms of seniors poverty over the age of 65, the demographic groups most similar to Welsh are Slovene (9.3%, a difference of 0.050%), Bulgarian (9.3%, a difference of 0.070%), Luxembourger (9.2%, a difference of 0.080%), Irish (9.3%, a difference of 0.35%), and Thai (9.2%, a difference of 0.37%).
| Demographics | Rating | Rank | Seniors Poverty Over the Age of 65 |
| Europeans | 99.9 /100 | #16 | Exceptional 9.2% |
| Scottish | 99.9 /100 | #17 | Exceptional 9.2% |
| Slovaks | 99.9 /100 | #18 | Exceptional 9.2% |
| Swiss | 99.9 /100 | #19 | Exceptional 9.2% |
| Thais | 99.9 /100 | #20 | Exceptional 9.2% |
| Luxembourgers | 99.9 /100 | #21 | Exceptional 9.2% |
| Slovenes | 99.9 /100 | #22 | Exceptional 9.3% |
| Welsh | 99.9 /100 | #23 | Exceptional 9.3% |
| Bulgarians | 99.9 /100 | #24 | Exceptional 9.3% |
| Irish | 99.9 /100 | #25 | Exceptional 9.3% |
| Immigrants | Scotland | 99.9 /100 | #26 | Exceptional 9.3% |
| Italians | 99.9 /100 | #27 | Exceptional 9.3% |
| Tongans | 99.9 /100 | #28 | Exceptional 9.3% |
| Bhutanese | 99.9 /100 | #29 | Exceptional 9.3% |
| Menominee | 99.8 /100 | #30 | Exceptional 9.4% |
Demographics Similar to Immigrants from Central America by Seniors Poverty Over the Age of 65
In terms of seniors poverty over the age of 65, the demographic groups most similar to Immigrants from Central America are Jamaican (13.6%, a difference of 0.0%), Belizean (13.6%, a difference of 0.27%), Immigrants from Mexico (13.6%, a difference of 0.41%), Black/African American (13.7%, a difference of 0.46%), and Immigrants from Senegal (13.6%, a difference of 0.53%).
| Demographics | Rating | Rank | Seniors Poverty Over the Age of 65 |
| Central Americans | 0.0 /100 | #283 | Tragic 13.4% |
| Colville | 0.0 /100 | #284 | Tragic 13.5% |
| Guatemalans | 0.0 /100 | #285 | Tragic 13.5% |
| Immigrants | Senegal | 0.0 /100 | #286 | Tragic 13.6% |
| Immigrants | Mexico | 0.0 /100 | #287 | Tragic 13.6% |
| Belizeans | 0.0 /100 | #288 | Tragic 13.6% |
| Jamaicans | 0.0 /100 | #289 | Tragic 13.6% |
| Immigrants | Central America | 0.0 /100 | #290 | Tragic 13.6% |
| Blacks/African Americans | 0.0 /100 | #291 | Tragic 13.7% |
| Spanish American Indians | 0.0 /100 | #292 | Tragic 13.8% |
| Immigrants | Guatemala | 0.0 /100 | #293 | Tragic 13.8% |
| Cheyenne | 0.0 /100 | #294 | Tragic 13.9% |
| Apache | 0.0 /100 | #295 | Tragic 13.9% |
| Immigrants | Jamaica | 0.0 /100 | #296 | Tragic 13.9% |
| Vietnamese | 0.0 /100 | #297 | Tragic 14.0% |