Immigrants from Jordan vs Senegalese Median Family Income
COMPARE
Immigrants from Jordan
Senegalese
Median Family Income
Median Family Income Comparison
Immigrants from Jordan
Senegalese
$107,715
MEDIAN FAMILY INCOME
92.9/ 100
METRIC RATING
122nd/ 347
METRIC RANK
$91,475
MEDIAN FAMILY INCOME
0.3/ 100
METRIC RATING
264th/ 347
METRIC RANK
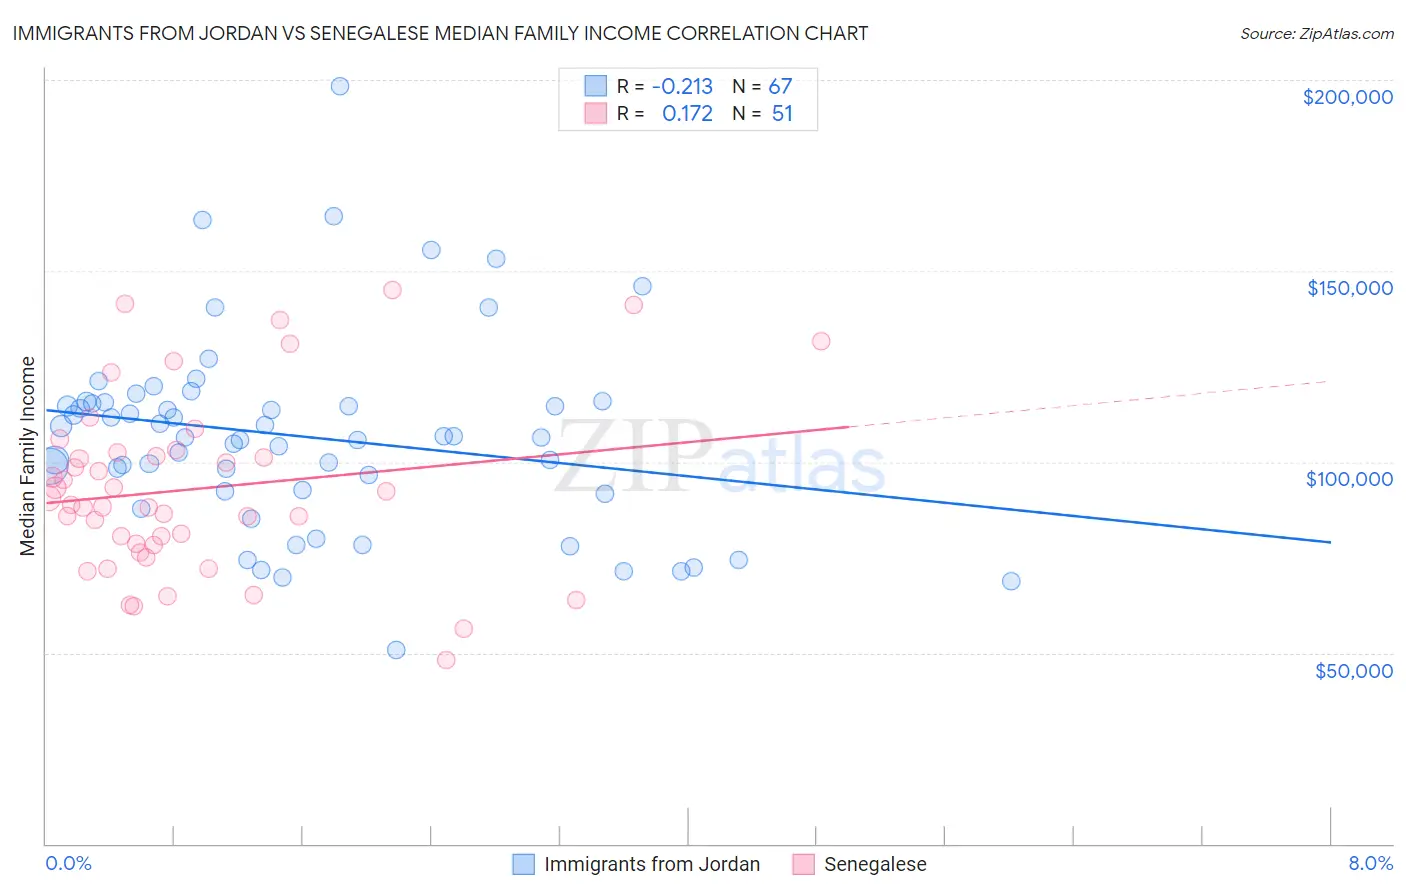
Immigrants from Jordan vs Senegalese Median Family Income Correlation Chart
The statistical analysis conducted on geographies consisting of 181,223,835 people shows a weak negative correlation between the proportion of Immigrants from Jordan and median family income in the United States with a correlation coefficient (R) of -0.213 and weighted average of $107,715. Similarly, the statistical analysis conducted on geographies consisting of 78,068,441 people shows a poor positive correlation between the proportion of Senegalese and median family income in the United States with a correlation coefficient (R) of 0.172 and weighted average of $91,475, a difference of 17.7%.
Median Family Income Correlation Summary
| Measurement | Immigrants from Jordan | Senegalese |
| Minimum | $50,608 | $48,125 |
| Maximum | $198,467 | $145,000 |
| Range | $147,858 | $96,875 |
| Mean | $106,593 | $92,900 |
| Median | $106,540 | $88,669 |
| Interquartile 25% (IQ1) | $92,338 | $78,308 |
| Interquartile 75% (IQ3) | $115,517 | $102,554 |
| Interquartile Range (IQR) | $23,179 | $24,246 |
| Standard Deviation (Sample) | $25,689 | $22,975 |
| Standard Deviation (Population) | $25,497 | $22,749 |
Similar Demographics by Median Family Income
Demographics Similar to Immigrants from Jordan by Median Family Income
In terms of median family income, the demographic groups most similar to Immigrants from Jordan are Carpatho Rusyn ($107,502, a difference of 0.20%), Pakistani ($107,390, a difference of 0.30%), European ($108,099, a difference of 0.36%), Taiwanese ($107,295, a difference of 0.39%), and Immigrants from Northern Africa ($108,161, a difference of 0.41%).
| Demographics | Rating | Rank | Median Family Income |
| Swedes | 95.1 /100 | #115 | Exceptional $108,499 |
| Chileans | 95.0 /100 | #116 | Exceptional $108,429 |
| Immigrants | Philippines | 94.6 /100 | #117 | Exceptional $108,288 |
| Ethiopians | 94.5 /100 | #118 | Exceptional $108,251 |
| Sri Lankans | 94.5 /100 | #119 | Exceptional $108,234 |
| Immigrants | Northern Africa | 94.3 /100 | #120 | Exceptional $108,161 |
| Europeans | 94.1 /100 | #121 | Exceptional $108,099 |
| Immigrants | Jordan | 92.9 /100 | #122 | Exceptional $107,715 |
| Carpatho Rusyns | 92.2 /100 | #123 | Exceptional $107,502 |
| Pakistanis | 91.7 /100 | #124 | Exceptional $107,390 |
| Taiwanese | 91.4 /100 | #125 | Exceptional $107,295 |
| Serbians | 90.8 /100 | #126 | Exceptional $107,157 |
| Lebanese | 90.5 /100 | #127 | Exceptional $107,086 |
| Immigrants | Ethiopia | 90.0 /100 | #128 | Excellent $106,969 |
| Arabs | 89.9 /100 | #129 | Excellent $106,952 |
Demographics Similar to Senegalese by Median Family Income
In terms of median family income, the demographic groups most similar to Senegalese are Immigrants from West Indies ($91,588, a difference of 0.12%), Hmong ($91,296, a difference of 0.20%), Liberian ($91,722, a difference of 0.27%), Inupiat ($91,730, a difference of 0.28%), and Pennsylvania German ($91,763, a difference of 0.31%).
| Demographics | Rating | Rank | Median Family Income |
| Americans | 0.4 /100 | #257 | Tragic $92,096 |
| Osage | 0.4 /100 | #258 | Tragic $91,926 |
| Cape Verdeans | 0.4 /100 | #259 | Tragic $91,848 |
| Pennsylvania Germans | 0.4 /100 | #260 | Tragic $91,763 |
| Inupiat | 0.4 /100 | #261 | Tragic $91,730 |
| Liberians | 0.4 /100 | #262 | Tragic $91,722 |
| Immigrants | West Indies | 0.3 /100 | #263 | Tragic $91,588 |
| Senegalese | 0.3 /100 | #264 | Tragic $91,475 |
| Hmong | 0.3 /100 | #265 | Tragic $91,296 |
| Central Americans | 0.3 /100 | #266 | Tragic $91,087 |
| Mexican American Indians | 0.2 /100 | #267 | Tragic $90,918 |
| Cree | 0.2 /100 | #268 | Tragic $90,882 |
| Belizeans | 0.2 /100 | #269 | Tragic $90,880 |
| Jamaicans | 0.2 /100 | #270 | Tragic $90,581 |
| Iroquois | 0.2 /100 | #271 | Tragic $90,543 |