Vietnamese vs Maltese Median Earnings
COMPARE
Vietnamese
Maltese
Median Earnings
Median Earnings Comparison
Vietnamese
Maltese
$46,172
MEDIAN EARNINGS
40.9/ 100
METRIC RATING
186th/ 347
METRIC RANK
$52,526
MEDIAN EARNINGS
100.0/ 100
METRIC RATING
42nd/ 347
METRIC RANK
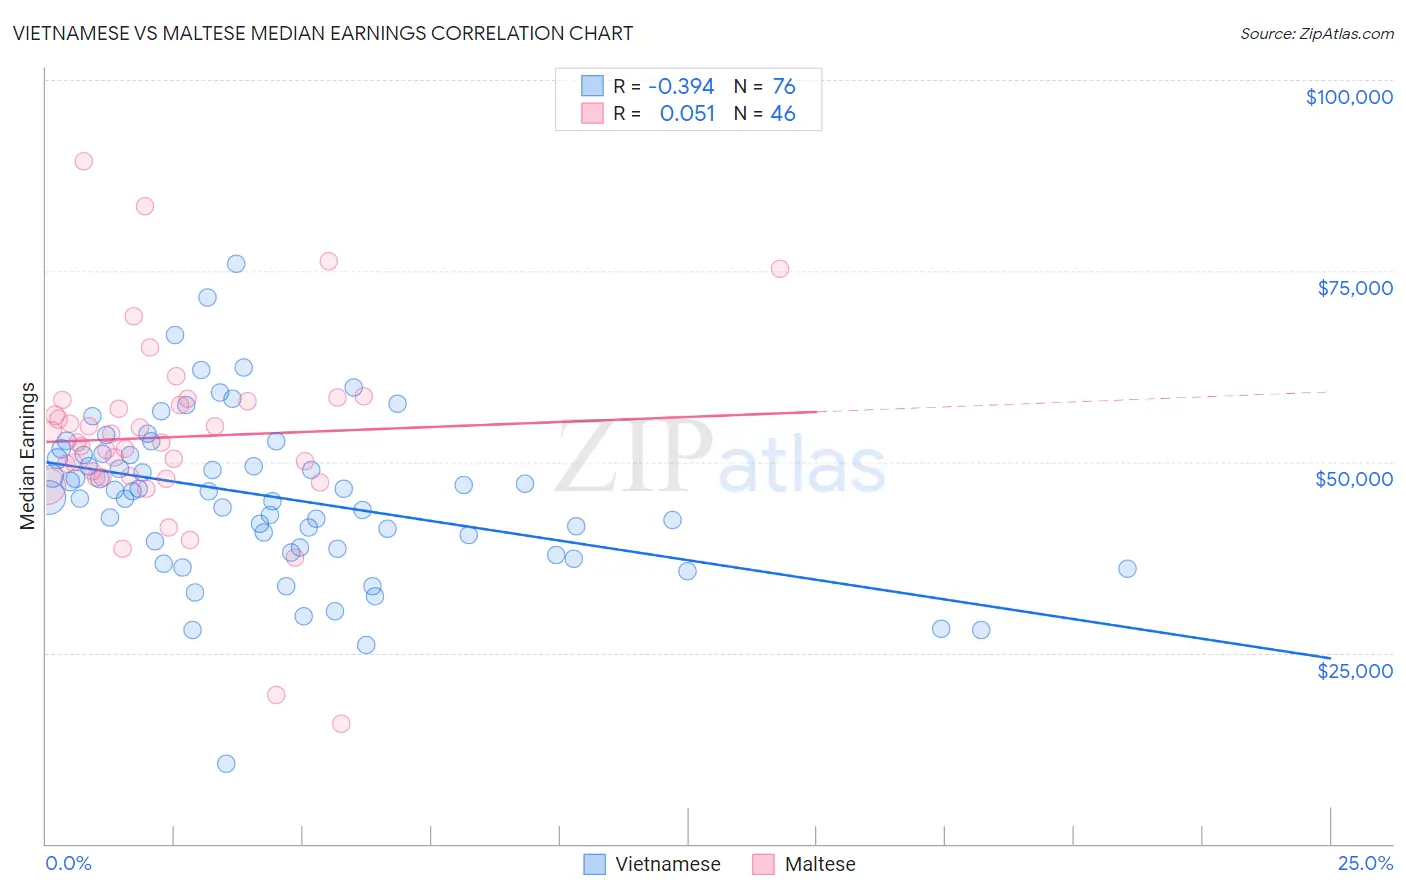
Vietnamese vs Maltese Median Earnings Correlation Chart
The statistical analysis conducted on geographies consisting of 170,754,032 people shows a mild negative correlation between the proportion of Vietnamese and median earnings in the United States with a correlation coefficient (R) of -0.394 and weighted average of $46,172. Similarly, the statistical analysis conducted on geographies consisting of 126,475,400 people shows a slight positive correlation between the proportion of Maltese and median earnings in the United States with a correlation coefficient (R) of 0.051 and weighted average of $52,526, a difference of 13.8%.
Median Earnings Correlation Summary
| Measurement | Vietnamese | Maltese |
| Minimum | $10,473 | $15,781 |
| Maximum | $75,862 | $89,336 |
| Range | $65,389 | $73,555 |
| Mean | $45,384 | $53,240 |
| Median | $46,190 | $52,561 |
| Interquartile 25% (IQ1) | $38,745 | $48,020 |
| Interquartile 75% (IQ3) | $50,994 | $57,908 |
| Interquartile Range (IQR) | $12,249 | $9,888 |
| Standard Deviation (Sample) | $10,718 | $12,910 |
| Standard Deviation (Population) | $10,647 | $12,769 |
Similar Demographics by Median Earnings
Demographics Similar to Vietnamese by Median Earnings
In terms of median earnings, the demographic groups most similar to Vietnamese are Uruguayan ($46,190, a difference of 0.040%), Iraqi ($46,140, a difference of 0.070%), Immigrants from Kenya ($46,214, a difference of 0.090%), Immigrants from Armenia ($46,094, a difference of 0.17%), and Spaniard ($46,059, a difference of 0.24%).
| Demographics | Rating | Rank | Median Earnings |
| English | 46.5 /100 | #179 | Average $46,334 |
| Puget Sound Salish | 46.5 /100 | #180 | Average $46,333 |
| Immigrants | Cameroon | 46.4 /100 | #181 | Average $46,329 |
| Swiss | 45.9 /100 | #182 | Average $46,315 |
| French | 45.2 /100 | #183 | Average $46,296 |
| Immigrants | Kenya | 42.4 /100 | #184 | Average $46,214 |
| Uruguayans | 41.6 /100 | #185 | Average $46,190 |
| Vietnamese | 40.9 /100 | #186 | Average $46,172 |
| Iraqis | 39.9 /100 | #187 | Fair $46,140 |
| Immigrants | Armenia | 38.3 /100 | #188 | Fair $46,094 |
| Spaniards | 37.2 /100 | #189 | Fair $46,059 |
| French Canadians | 36.1 /100 | #190 | Fair $46,026 |
| Finns | 33.4 /100 | #191 | Fair $45,940 |
| Germans | 33.2 /100 | #192 | Fair $45,935 |
| Guamanians/Chamorros | 33.2 /100 | #193 | Fair $45,933 |
Demographics Similar to Maltese by Median Earnings
In terms of median earnings, the demographic groups most similar to Maltese are Immigrants from Malaysia ($52,514, a difference of 0.020%), Bulgarian ($52,512, a difference of 0.030%), Immigrants from Czechoslovakia ($52,361, a difference of 0.31%), Bhutanese ($52,297, a difference of 0.44%), and Australian ($52,294, a difference of 0.44%).
| Demographics | Rating | Rank | Median Earnings |
| Immigrants | Switzerland | 100.0 /100 | #35 | Exceptional $53,211 |
| Immigrants | Denmark | 100.0 /100 | #36 | Exceptional $53,186 |
| Immigrants | Belarus | 100.0 /100 | #37 | Exceptional $53,043 |
| Latvians | 100.0 /100 | #38 | Exceptional $53,001 |
| Immigrants | Turkey | 100.0 /100 | #39 | Exceptional $52,960 |
| Israelis | 100.0 /100 | #40 | Exceptional $52,937 |
| Immigrants | Lithuania | 100.0 /100 | #41 | Exceptional $52,769 |
| Maltese | 100.0 /100 | #42 | Exceptional $52,526 |
| Immigrants | Malaysia | 100.0 /100 | #43 | Exceptional $52,514 |
| Bulgarians | 100.0 /100 | #44 | Exceptional $52,512 |
| Immigrants | Czechoslovakia | 100.0 /100 | #45 | Exceptional $52,361 |
| Bhutanese | 100.0 /100 | #46 | Exceptional $52,297 |
| Australians | 100.0 /100 | #47 | Exceptional $52,294 |
| Immigrants | Europe | 100.0 /100 | #48 | Exceptional $52,195 |
| Bolivians | 100.0 /100 | #49 | Exceptional $52,005 |