Albanian vs Guyanese Per Capita Income
COMPARE
Albanian
Guyanese
Per Capita Income
Per Capita Income Comparison
Albanians
Guyanese
$47,379
PER CAPITA INCOME
98.5/ 100
METRIC RATING
94th/ 347
METRIC RANK
$40,949
PER CAPITA INCOME
4.5/ 100
METRIC RATING
232nd/ 347
METRIC RANK
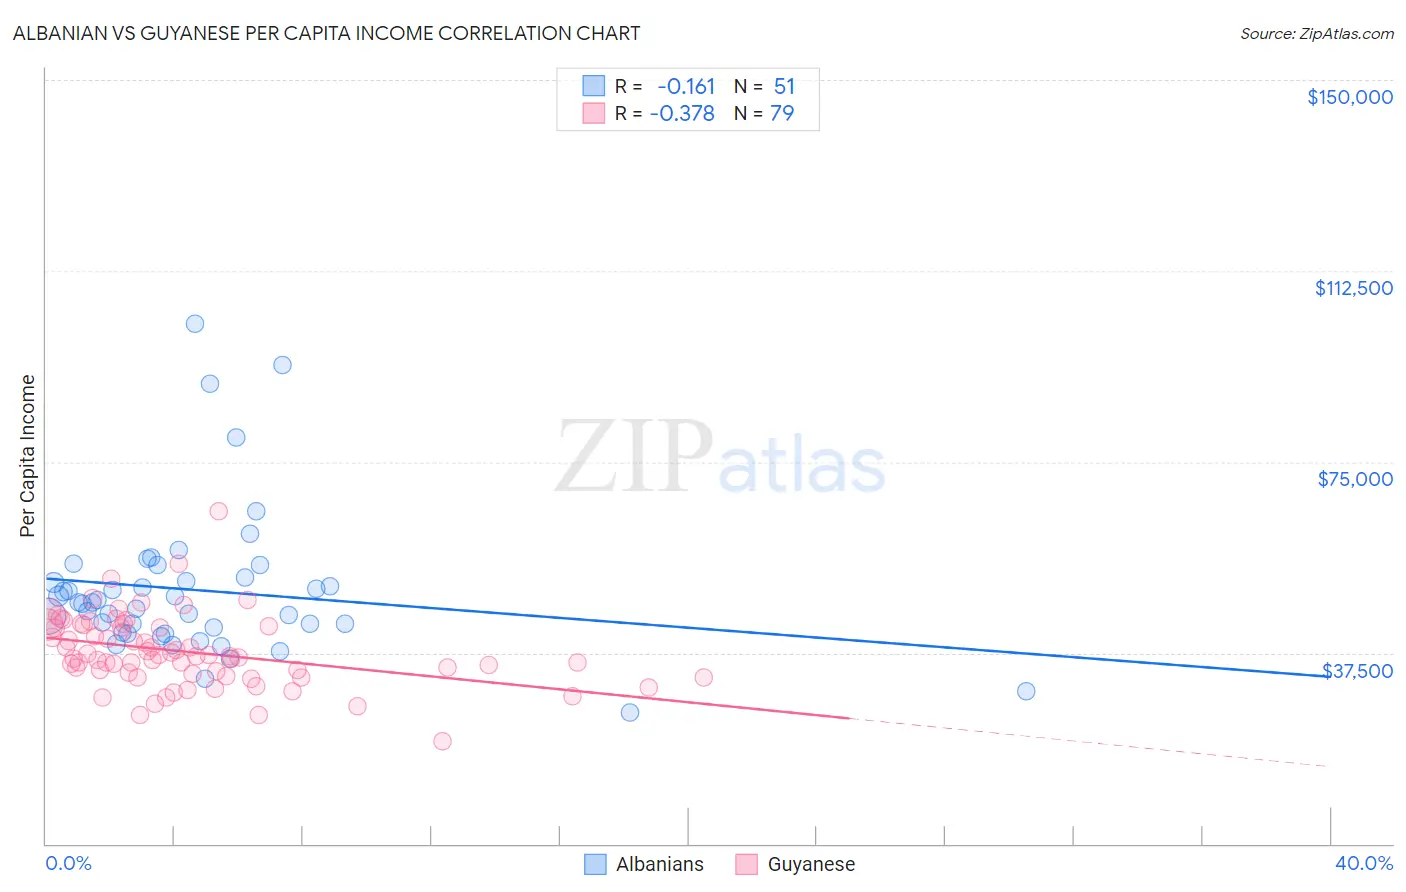
Albanian vs Guyanese Per Capita Income Correlation Chart
The statistical analysis conducted on geographies consisting of 193,264,500 people shows a poor negative correlation between the proportion of Albanians and per capita income in the United States with a correlation coefficient (R) of -0.161 and weighted average of $47,379. Similarly, the statistical analysis conducted on geographies consisting of 176,945,802 people shows a mild negative correlation between the proportion of Guyanese and per capita income in the United States with a correlation coefficient (R) of -0.378 and weighted average of $40,949, a difference of 15.7%.
Per Capita Income Correlation Summary
| Measurement | Albanian | Guyanese |
| Minimum | $25,698 | $20,131 |
| Maximum | $102,102 | $65,314 |
| Range | $76,404 | $45,183 |
| Mean | $49,796 | $37,694 |
| Median | $47,330 | $36,719 |
| Interquartile 25% (IQ1) | $41,568 | $33,285 |
| Interquartile 75% (IQ3) | $52,221 | $42,829 |
| Interquartile Range (IQR) | $10,654 | $9,544 |
| Standard Deviation (Sample) | $14,520 | $7,132 |
| Standard Deviation (Population) | $14,376 | $7,087 |
Similar Demographics by Per Capita Income
Demographics Similar to Albanians by Per Capita Income
In terms of per capita income, the demographic groups most similar to Albanians are Immigrants from Zimbabwe ($47,394, a difference of 0.030%), Immigrants from Egypt ($47,361, a difference of 0.040%), Alsatian ($47,284, a difference of 0.20%), Immigrants from Moldova ($47,489, a difference of 0.23%), and Carpatho Rusyn ($47,248, a difference of 0.28%).
| Demographics | Rating | Rank | Per Capita Income |
| Ukrainians | 99.3 /100 | #87 | Exceptional $48,014 |
| Croatians | 99.0 /100 | #88 | Exceptional $47,742 |
| Northern Europeans | 98.9 /100 | #89 | Exceptional $47,698 |
| Italians | 98.8 /100 | #90 | Exceptional $47,574 |
| Macedonians | 98.8 /100 | #91 | Exceptional $47,573 |
| Immigrants | Moldova | 98.7 /100 | #92 | Exceptional $47,489 |
| Immigrants | Zimbabwe | 98.5 /100 | #93 | Exceptional $47,394 |
| Albanians | 98.5 /100 | #94 | Exceptional $47,379 |
| Immigrants | Egypt | 98.5 /100 | #95 | Exceptional $47,361 |
| Alsatians | 98.3 /100 | #96 | Exceptional $47,284 |
| Carpatho Rusyns | 98.2 /100 | #97 | Exceptional $47,248 |
| Immigrants | Pakistan | 97.9 /100 | #98 | Exceptional $47,084 |
| Laotians | 97.8 /100 | #99 | Exceptional $47,041 |
| Immigrants | Lebanon | 97.5 /100 | #100 | Exceptional $46,938 |
| Immigrants | Uzbekistan | 97.5 /100 | #101 | Exceptional $46,929 |
Demographics Similar to Guyanese by Per Capita Income
In terms of per capita income, the demographic groups most similar to Guyanese are Senegalese ($41,000, a difference of 0.12%), Native Hawaiian ($41,017, a difference of 0.16%), Nigerian ($41,026, a difference of 0.19%), Immigrants from Grenada ($41,123, a difference of 0.42%), and Delaware ($40,778, a difference of 0.42%).
| Demographics | Rating | Rank | Per Capita Income |
| West Indians | 6.0 /100 | #225 | Tragic $41,217 |
| Immigrants | Ecuador | 5.9 /100 | #226 | Tragic $41,195 |
| Immigrants | Ghana | 5.5 /100 | #227 | Tragic $41,131 |
| Immigrants | Grenada | 5.5 /100 | #228 | Tragic $41,123 |
| Nigerians | 4.9 /100 | #229 | Tragic $41,026 |
| Native Hawaiians | 4.9 /100 | #230 | Tragic $41,017 |
| Senegalese | 4.8 /100 | #231 | Tragic $41,000 |
| Guyanese | 4.5 /100 | #232 | Tragic $40,949 |
| Delaware | 3.8 /100 | #233 | Tragic $40,778 |
| Immigrants | West Indies | 3.7 /100 | #234 | Tragic $40,763 |
| Immigrants | Guyana | 3.6 /100 | #235 | Tragic $40,742 |
| Immigrants | Nonimmigrants | 3.4 /100 | #236 | Tragic $40,669 |
| Immigrants | Cambodia | 2.6 /100 | #237 | Tragic $40,434 |
| Somalis | 2.4 /100 | #238 | Tragic $40,367 |
| Tsimshian | 2.4 /100 | #239 | Tragic $40,344 |