Ute vs Guyanese 10th Grade
COMPARE
Ute
Guyanese
10th Grade
10th Grade Comparison
Ute
Guyanese
93.4%
10TH GRADE
20.3/ 100
METRIC RATING
204th/ 347
METRIC RANK
91.4%
10TH GRADE
0.0/ 100
METRIC RATING
300th/ 347
METRIC RANK
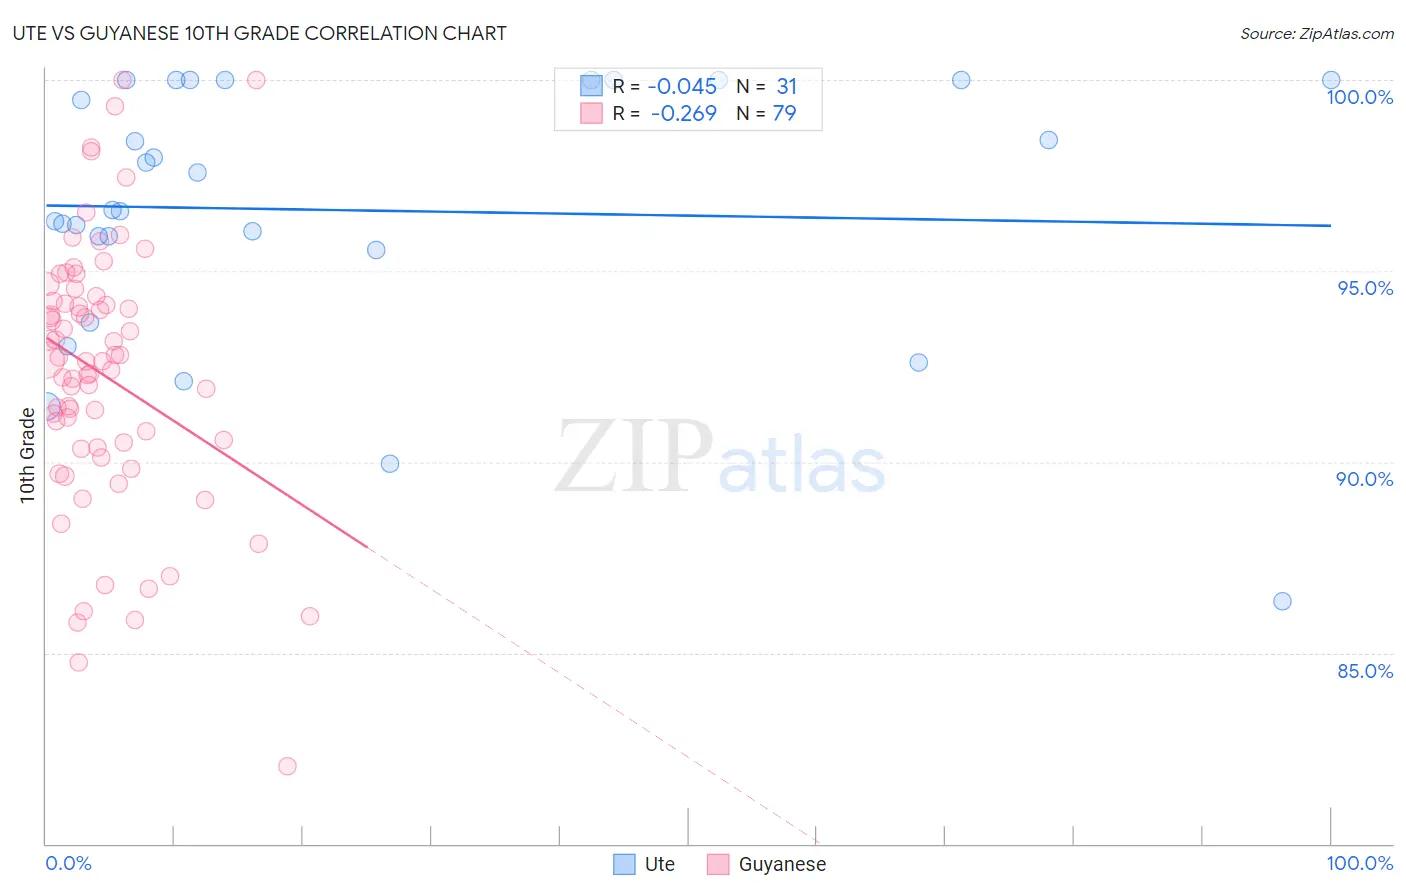
Ute vs Guyanese 10th Grade Correlation Chart
The statistical analysis conducted on geographies consisting of 55,668,539 people shows no correlation between the proportion of Ute and percentage of population with at least 10th grade education in the United States with a correlation coefficient (R) of -0.045 and weighted average of 93.4%. Similarly, the statistical analysis conducted on geographies consisting of 176,937,226 people shows a weak negative correlation between the proportion of Guyanese and percentage of population with at least 10th grade education in the United States with a correlation coefficient (R) of -0.269 and weighted average of 91.4%, a difference of 2.3%.
10th Grade Correlation Summary
| Measurement | Ute | Guyanese |
| Minimum | 86.4% | 82.0% |
| Maximum | 100.0% | 100.0% |
| Range | 13.6% | 18.0% |
| Mean | 96.6% | 92.3% |
| Median | 96.6% | 92.6% |
| Interquartile 25% (IQ1) | 95.6% | 90.4% |
| Interquartile 75% (IQ3) | 100.0% | 94.2% |
| Interquartile Range (IQR) | 4.4% | 3.8% |
| Standard Deviation (Sample) | 3.5% | 3.5% |
| Standard Deviation (Population) | 3.4% | 3.5% |
Similar Demographics by 10th Grade
Demographics Similar to Ute by 10th Grade
In terms of 10th grade, the demographic groups most similar to Ute are Immigrants from Western Asia (93.4%, a difference of 0.0%), Immigrants from Indonesia (93.4%, a difference of 0.0%), Immigrants from Sudan (93.4%, a difference of 0.0%), Immigrants from Uganda (93.5%, a difference of 0.010%), and Samoan (93.4%, a difference of 0.010%).
| Demographics | Rating | Rank | 10th Grade |
| Pueblo | 23.9 /100 | #197 | Fair 93.5% |
| Immigrants | Micronesia | 23.2 /100 | #198 | Fair 93.5% |
| Asians | 23.0 /100 | #199 | Fair 93.5% |
| Hopi | 22.2 /100 | #200 | Fair 93.5% |
| Hawaiians | 21.8 /100 | #201 | Fair 93.5% |
| Immigrants | Uganda | 20.9 /100 | #202 | Fair 93.5% |
| Immigrants | Western Asia | 20.6 /100 | #203 | Fair 93.4% |
| Ute | 20.3 /100 | #204 | Fair 93.4% |
| Immigrants | Indonesia | 20.2 /100 | #205 | Fair 93.4% |
| Immigrants | Sudan | 20.0 /100 | #206 | Fair 93.4% |
| Samoans | 19.5 /100 | #207 | Poor 93.4% |
| Immigrants | Syria | 19.4 /100 | #208 | Poor 93.4% |
| Immigrants | Chile | 18.8 /100 | #209 | Poor 93.4% |
| Indians (Asian) | 17.6 /100 | #210 | Poor 93.4% |
| Cajuns | 16.9 /100 | #211 | Poor 93.4% |
Demographics Similar to Guyanese by 10th Grade
In terms of 10th grade, the demographic groups most similar to Guyanese are Immigrants from Haiti (91.4%, a difference of 0.050%), Cuban (91.5%, a difference of 0.12%), Fijian (91.5%, a difference of 0.15%), Japanese (91.2%, a difference of 0.15%), and Immigrants from Guyana (91.2%, a difference of 0.16%).
| Demographics | Rating | Rank | 10th Grade |
| Indonesians | 0.0 /100 | #293 | Tragic 91.8% |
| Haitians | 0.0 /100 | #294 | Tragic 91.8% |
| Lumbee | 0.0 /100 | #295 | Tragic 91.7% |
| Immigrants | Grenada | 0.0 /100 | #296 | Tragic 91.6% |
| Fijians | 0.0 /100 | #297 | Tragic 91.5% |
| Cubans | 0.0 /100 | #298 | Tragic 91.5% |
| Immigrants | Haiti | 0.0 /100 | #299 | Tragic 91.4% |
| Guyanese | 0.0 /100 | #300 | Tragic 91.4% |
| Japanese | 0.0 /100 | #301 | Tragic 91.2% |
| Immigrants | Guyana | 0.0 /100 | #302 | Tragic 91.2% |
| Immigrants | Vietnam | 0.0 /100 | #303 | Tragic 91.2% |
| Pima | 0.0 /100 | #304 | Tragic 91.2% |
| Immigrants | Dominica | 0.0 /100 | #305 | Tragic 91.1% |
| Yaqui | 0.0 /100 | #306 | Tragic 91.1% |
| Immigrants | Fiji | 0.0 /100 | #307 | Tragic 91.0% |