South American Indian vs Guyanese Per Capita Income
COMPARE
South American Indian
Guyanese
Per Capita Income
Per Capita Income Comparison
South American Indians
Guyanese
$44,206
PER CAPITA INCOME
64.8/ 100
METRIC RATING
157th/ 347
METRIC RANK
$40,949
PER CAPITA INCOME
4.5/ 100
METRIC RATING
232nd/ 347
METRIC RANK
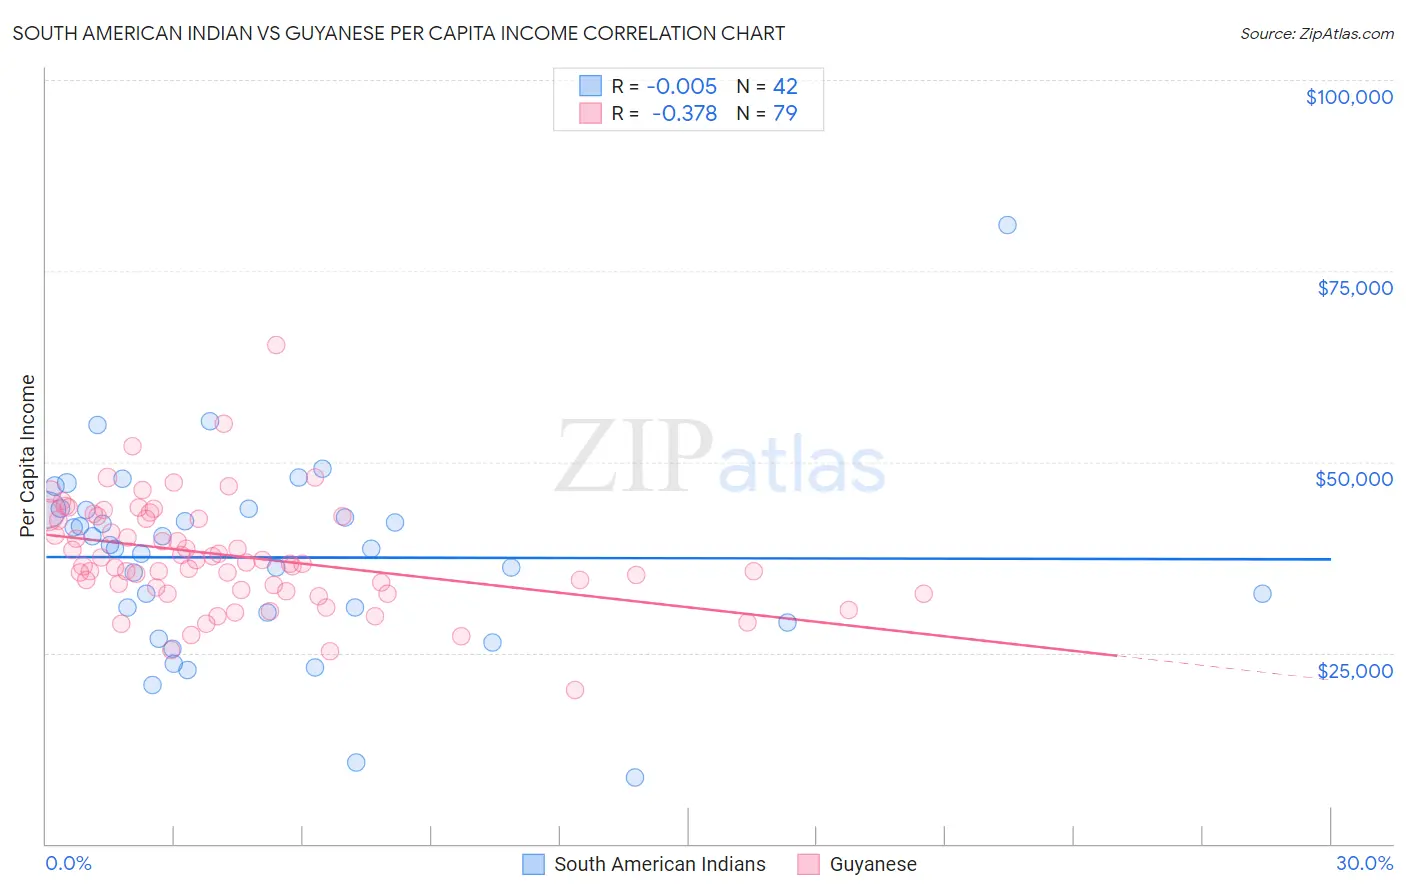
South American Indian vs Guyanese Per Capita Income Correlation Chart
The statistical analysis conducted on geographies consisting of 164,572,672 people shows no correlation between the proportion of South American Indians and per capita income in the United States with a correlation coefficient (R) of -0.005 and weighted average of $44,206. Similarly, the statistical analysis conducted on geographies consisting of 176,945,802 people shows a mild negative correlation between the proportion of Guyanese and per capita income in the United States with a correlation coefficient (R) of -0.378 and weighted average of $40,949, a difference of 8.0%.
Per Capita Income Correlation Summary
| Measurement | South American Indian | Guyanese |
| Minimum | $8,682 | $20,131 |
| Maximum | $81,082 | $65,314 |
| Range | $72,400 | $45,183 |
| Mean | $37,494 | $37,694 |
| Median | $38,904 | $36,719 |
| Interquartile 25% (IQ1) | $30,264 | $33,285 |
| Interquartile 75% (IQ3) | $43,746 | $42,829 |
| Interquartile Range (IQR) | $13,482 | $9,544 |
| Standard Deviation (Sample) | $12,540 | $7,132 |
| Standard Deviation (Population) | $12,390 | $7,087 |
Similar Demographics by Per Capita Income
Demographics Similar to South American Indians by Per Capita Income
In terms of per capita income, the demographic groups most similar to South American Indians are Immigrants from Nepal ($44,187, a difference of 0.040%), Slovak ($44,229, a difference of 0.050%), South American ($44,114, a difference of 0.21%), Uruguayan ($44,318, a difference of 0.25%), and Danish ($44,095, a difference of 0.25%).
| Demographics | Rating | Rank | Per Capita Income |
| Immigrants | Eritrea | 72.1 /100 | #150 | Good $44,509 |
| Norwegians | 71.5 /100 | #151 | Good $44,480 |
| Peruvians | 71.5 /100 | #152 | Good $44,479 |
| Scottish | 70.6 /100 | #153 | Good $44,440 |
| Portuguese | 68.7 /100 | #154 | Good $44,362 |
| Uruguayans | 67.6 /100 | #155 | Good $44,318 |
| Slovaks | 65.4 /100 | #156 | Good $44,229 |
| South American Indians | 64.8 /100 | #157 | Good $44,206 |
| Immigrants | Nepal | 64.3 /100 | #158 | Good $44,187 |
| South Americans | 62.4 /100 | #159 | Good $44,114 |
| Danes | 61.9 /100 | #160 | Good $44,095 |
| Costa Ricans | 61.8 /100 | #161 | Good $44,090 |
| Swiss | 61.4 /100 | #162 | Good $44,076 |
| Immigrants | South America | 61.2 /100 | #163 | Good $44,068 |
| Sri Lankans | 59.8 /100 | #164 | Average $44,014 |
Demographics Similar to Guyanese by Per Capita Income
In terms of per capita income, the demographic groups most similar to Guyanese are Senegalese ($41,000, a difference of 0.12%), Native Hawaiian ($41,017, a difference of 0.16%), Nigerian ($41,026, a difference of 0.19%), Immigrants from Grenada ($41,123, a difference of 0.42%), and Delaware ($40,778, a difference of 0.42%).
| Demographics | Rating | Rank | Per Capita Income |
| West Indians | 6.0 /100 | #225 | Tragic $41,217 |
| Immigrants | Ecuador | 5.9 /100 | #226 | Tragic $41,195 |
| Immigrants | Ghana | 5.5 /100 | #227 | Tragic $41,131 |
| Immigrants | Grenada | 5.5 /100 | #228 | Tragic $41,123 |
| Nigerians | 4.9 /100 | #229 | Tragic $41,026 |
| Native Hawaiians | 4.9 /100 | #230 | Tragic $41,017 |
| Senegalese | 4.8 /100 | #231 | Tragic $41,000 |
| Guyanese | 4.5 /100 | #232 | Tragic $40,949 |
| Delaware | 3.8 /100 | #233 | Tragic $40,778 |
| Immigrants | West Indies | 3.7 /100 | #234 | Tragic $40,763 |
| Immigrants | Guyana | 3.6 /100 | #235 | Tragic $40,742 |
| Immigrants | Nonimmigrants | 3.4 /100 | #236 | Tragic $40,669 |
| Immigrants | Cambodia | 2.6 /100 | #237 | Tragic $40,434 |
| Somalis | 2.4 /100 | #238 | Tragic $40,367 |
| Tsimshian | 2.4 /100 | #239 | Tragic $40,344 |