Uruguayan vs Northern European Median Male Earnings
COMPARE
Uruguayan
Northern European
Median Male Earnings
Median Male Earnings Comparison
Uruguayans
Northern Europeans
$53,680
MEDIAN MALE EARNINGS
31.1/ 100
METRIC RATING
190th/ 347
METRIC RANK
$58,588
MEDIAN MALE EARNINGS
98.2/ 100
METRIC RATING
97th/ 347
METRIC RANK
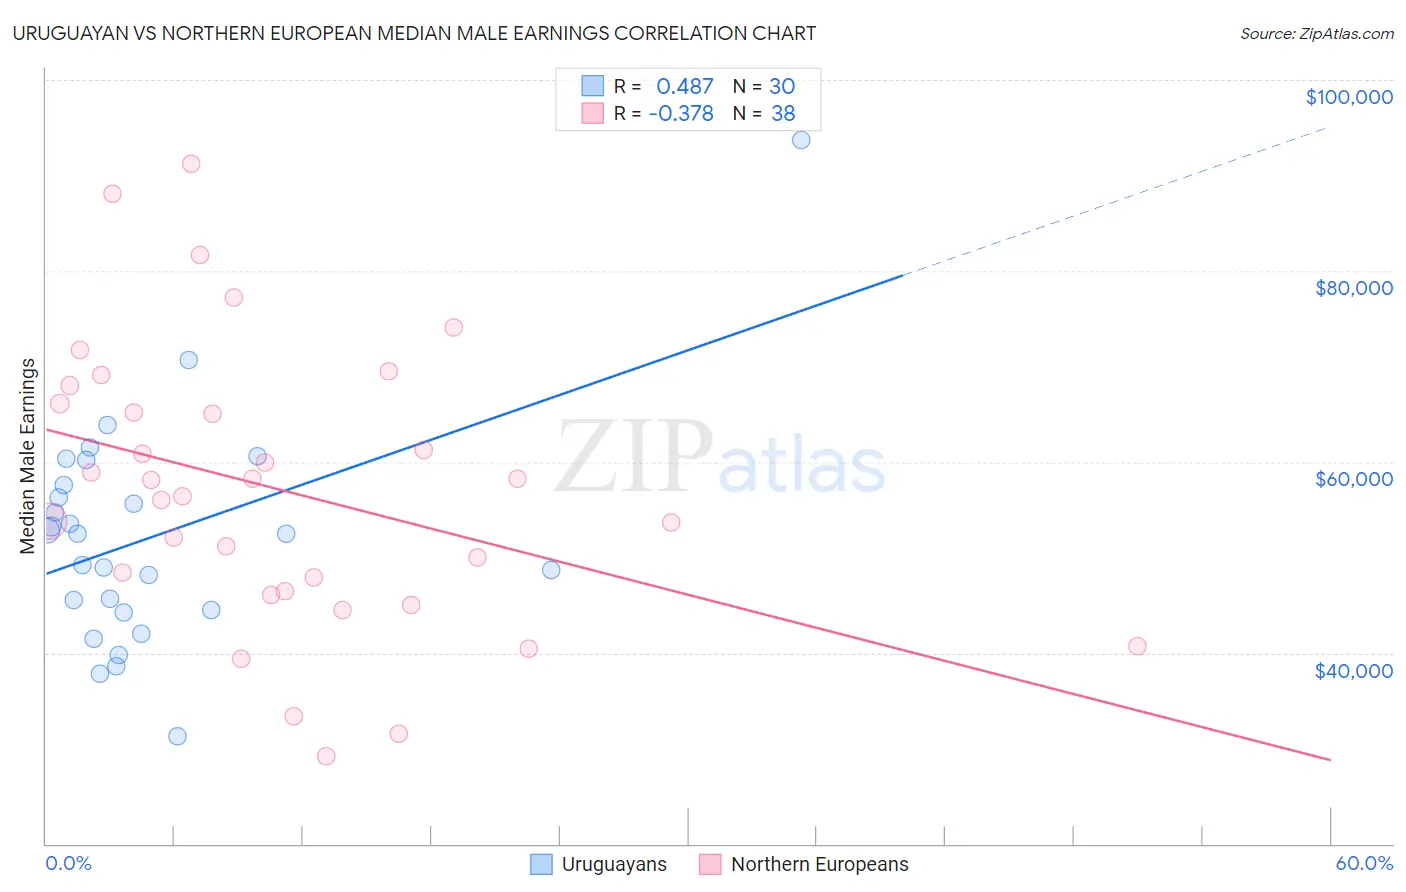
Uruguayan vs Northern European Median Male Earnings Correlation Chart
The statistical analysis conducted on geographies consisting of 144,776,277 people shows a moderate positive correlation between the proportion of Uruguayans and median male earnings in the United States with a correlation coefficient (R) of 0.487 and weighted average of $53,680. Similarly, the statistical analysis conducted on geographies consisting of 405,884,643 people shows a mild negative correlation between the proportion of Northern Europeans and median male earnings in the United States with a correlation coefficient (R) of -0.378 and weighted average of $58,588, a difference of 9.1%.
Median Male Earnings Correlation Summary
| Measurement | Uruguayan | Northern European |
| Minimum | $31,250 | $29,177 |
| Maximum | $93,710 | $91,267 |
| Range | $62,460 | $62,090 |
| Mean | $52,178 | $57,049 |
| Median | $52,491 | $57,215 |
| Interquartile 25% (IQ1) | $44,514 | $46,389 |
| Interquartile 75% (IQ3) | $57,550 | $66,077 |
| Interquartile Range (IQR) | $13,036 | $19,687 |
| Standard Deviation (Sample) | $11,765 | $14,710 |
| Standard Deviation (Population) | $11,568 | $14,515 |
Similar Demographics by Median Male Earnings
Demographics Similar to Uruguayans by Median Male Earnings
In terms of median male earnings, the demographic groups most similar to Uruguayans are Puget Sound Salish ($53,704, a difference of 0.040%), Guamanian/Chamorro ($53,661, a difference of 0.040%), Scotch-Irish ($53,658, a difference of 0.040%), Immigrants from Eritrea ($53,715, a difference of 0.060%), and Immigrants from Eastern Africa ($53,713, a difference of 0.060%).
| Demographics | Rating | Rank | Median Male Earnings |
| Immigrants | South America | 37.3 /100 | #183 | Fair $53,962 |
| Whites/Caucasians | 36.5 /100 | #184 | Fair $53,925 |
| Immigrants | Sierra Leone | 36.0 /100 | #185 | Fair $53,905 |
| Colombians | 34.4 /100 | #186 | Fair $53,832 |
| Immigrants | Eritrea | 31.8 /100 | #187 | Fair $53,715 |
| Immigrants | Eastern Africa | 31.8 /100 | #188 | Fair $53,713 |
| Puget Sound Salish | 31.6 /100 | #189 | Fair $53,704 |
| Uruguayans | 31.1 /100 | #190 | Fair $53,680 |
| Guamanians/Chamorros | 30.7 /100 | #191 | Fair $53,661 |
| Scotch-Irish | 30.6 /100 | #192 | Fair $53,658 |
| Kenyans | 30.4 /100 | #193 | Fair $53,647 |
| Spanish | 29.0 /100 | #194 | Fair $53,576 |
| Immigrants | Azores | 27.5 /100 | #195 | Fair $53,503 |
| Immigrants | Africa | 26.6 /100 | #196 | Fair $53,457 |
| Immigrants | Kenya | 26.0 /100 | #197 | Fair $53,427 |
Demographics Similar to Northern Europeans by Median Male Earnings
In terms of median male earnings, the demographic groups most similar to Northern Europeans are Jordanian ($58,500, a difference of 0.15%), Albanian ($58,680, a difference of 0.16%), Immigrants from Poland ($58,452, a difference of 0.23%), Assyrian/Chaldean/Syriac ($58,437, a difference of 0.26%), and Immigrants from Lebanon ($58,835, a difference of 0.42%).
| Demographics | Rating | Rank | Median Male Earnings |
| Austrians | 99.2 /100 | #90 | Exceptional $59,359 |
| Laotians | 99.2 /100 | #91 | Exceptional $59,351 |
| Immigrants | Kazakhstan | 99.1 /100 | #92 | Exceptional $59,278 |
| Immigrants | Southern Europe | 99.0 /100 | #93 | Exceptional $59,217 |
| Immigrants | North Macedonia | 99.0 /100 | #94 | Exceptional $59,189 |
| Immigrants | Lebanon | 98.6 /100 | #95 | Exceptional $58,835 |
| Albanians | 98.4 /100 | #96 | Exceptional $58,680 |
| Northern Europeans | 98.2 /100 | #97 | Exceptional $58,588 |
| Jordanians | 98.1 /100 | #98 | Exceptional $58,500 |
| Immigrants | Poland | 98.0 /100 | #99 | Exceptional $58,452 |
| Assyrians/Chaldeans/Syriacs | 97.9 /100 | #100 | Exceptional $58,437 |
| Immigrants | Brazil | 97.7 /100 | #101 | Exceptional $58,324 |
| Syrians | 97.4 /100 | #102 | Exceptional $58,187 |
| Poles | 97.3 /100 | #103 | Exceptional $58,139 |
| Armenians | 97.3 /100 | #104 | Exceptional $58,134 |