British vs Northern European Median Male Earnings
COMPARE
British
Northern European
Median Male Earnings
Median Male Earnings Comparison
British
Northern Europeans
$57,890
MEDIAN MALE EARNINGS
96.5/ 100
METRIC RATING
109th/ 347
METRIC RANK
$58,588
MEDIAN MALE EARNINGS
98.2/ 100
METRIC RATING
97th/ 347
METRIC RANK
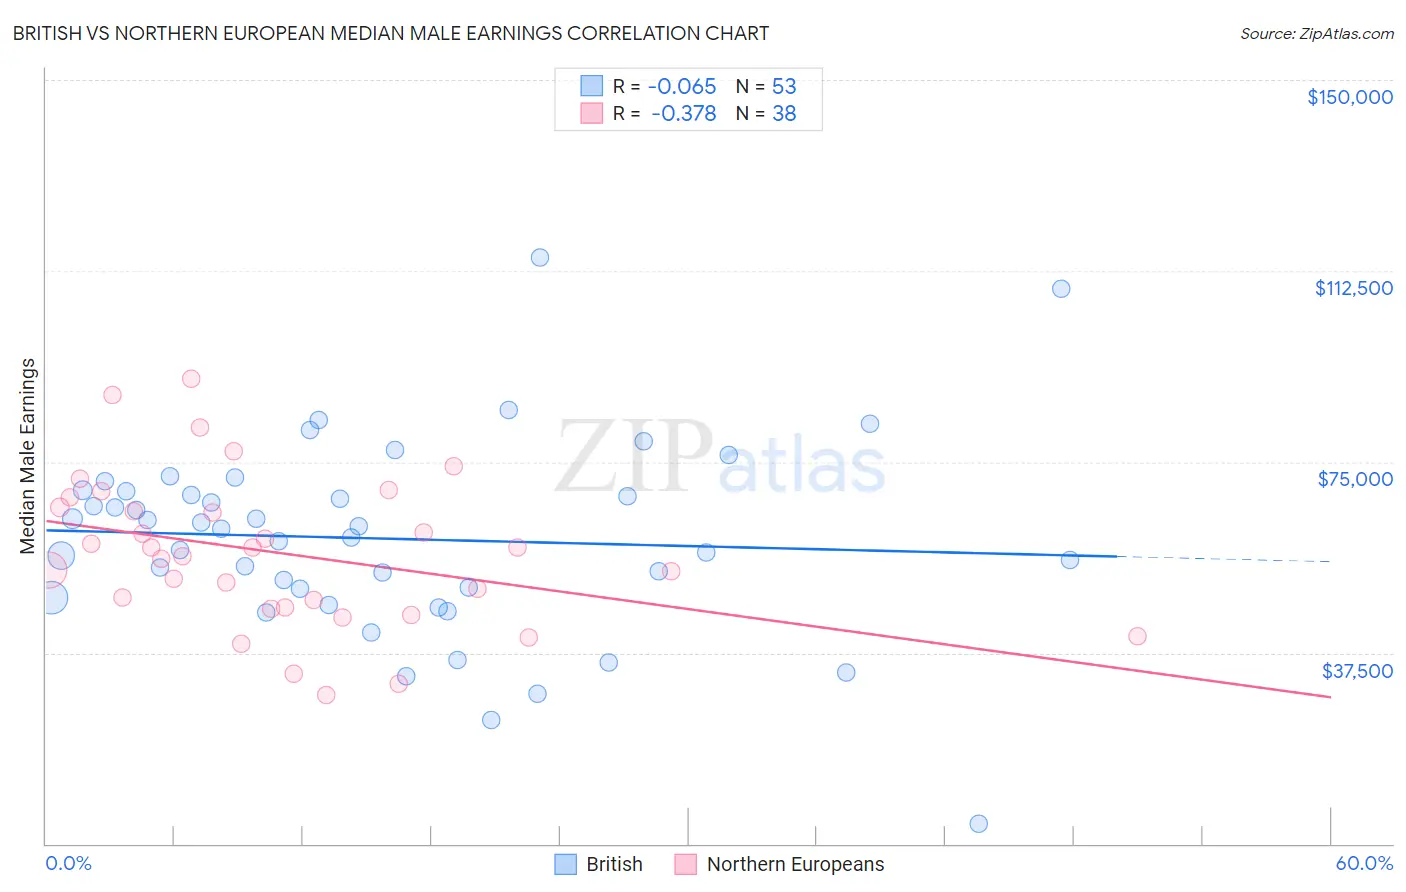
British vs Northern European Median Male Earnings Correlation Chart
The statistical analysis conducted on geographies consisting of 530,851,960 people shows a slight negative correlation between the proportion of British and median male earnings in the United States with a correlation coefficient (R) of -0.065 and weighted average of $57,890. Similarly, the statistical analysis conducted on geographies consisting of 405,884,643 people shows a mild negative correlation between the proportion of Northern Europeans and median male earnings in the United States with a correlation coefficient (R) of -0.378 and weighted average of $58,588, a difference of 1.2%.
Median Male Earnings Correlation Summary
| Measurement | British | Northern European |
| Minimum | $3,957 | $29,177 |
| Maximum | $115,192 | $91,267 |
| Range | $111,235 | $62,090 |
| Mean | $59,934 | $57,049 |
| Median | $61,983 | $57,215 |
| Interquartile 25% (IQ1) | $49,275 | $46,389 |
| Interquartile 75% (IQ3) | $69,382 | $66,077 |
| Interquartile Range (IQR) | $20,107 | $19,687 |
| Standard Deviation (Sample) | $19,214 | $14,710 |
| Standard Deviation (Population) | $19,032 | $14,515 |
Demographics Similar to British and Northern Europeans by Median Male Earnings
In terms of median male earnings, the demographic groups most similar to British are Immigrants from Uzbekistan ($57,941, a difference of 0.090%), Serbian ($57,975, a difference of 0.15%), Palestinian ($57,778, a difference of 0.19%), Immigrants from Northern Africa ($58,008, a difference of 0.20%), and Armenian ($58,134, a difference of 0.42%). Similarly, the demographic groups most similar to Northern Europeans are Jordanian ($58,500, a difference of 0.15%), Albanian ($58,680, a difference of 0.16%), Immigrants from Poland ($58,452, a difference of 0.23%), Assyrian/Chaldean/Syriac ($58,437, a difference of 0.26%), and Immigrants from Lebanon ($58,835, a difference of 0.42%).
| Demographics | Rating | Rank | Median Male Earnings |
| Immigrants | Southern Europe | 99.0 /100 | #93 | Exceptional $59,217 |
| Immigrants | North Macedonia | 99.0 /100 | #94 | Exceptional $59,189 |
| Immigrants | Lebanon | 98.6 /100 | #95 | Exceptional $58,835 |
| Albanians | 98.4 /100 | #96 | Exceptional $58,680 |
| Northern Europeans | 98.2 /100 | #97 | Exceptional $58,588 |
| Jordanians | 98.1 /100 | #98 | Exceptional $58,500 |
| Immigrants | Poland | 98.0 /100 | #99 | Exceptional $58,452 |
| Assyrians/Chaldeans/Syriacs | 97.9 /100 | #100 | Exceptional $58,437 |
| Immigrants | Brazil | 97.7 /100 | #101 | Exceptional $58,324 |
| Syrians | 97.4 /100 | #102 | Exceptional $58,187 |
| Poles | 97.3 /100 | #103 | Exceptional $58,139 |
| Armenians | 97.3 /100 | #104 | Exceptional $58,134 |
| Immigrants | Western Asia | 97.3 /100 | #105 | Exceptional $58,131 |
| Immigrants | Northern Africa | 96.9 /100 | #106 | Exceptional $58,008 |
| Serbians | 96.8 /100 | #107 | Exceptional $57,975 |
| Immigrants | Uzbekistan | 96.7 /100 | #108 | Exceptional $57,941 |
| British | 96.5 /100 | #109 | Exceptional $57,890 |
| Palestinians | 96.2 /100 | #110 | Exceptional $57,778 |
| Europeans | 95.6 /100 | #111 | Exceptional $57,637 |
| Immigrants | Afghanistan | 95.4 /100 | #112 | Exceptional $57,582 |
| Carpatho Rusyns | 95.3 /100 | #113 | Exceptional $57,572 |