Immigrants from Kazakhstan vs Native/Alaskan Median Family Income
COMPARE
Immigrants from Kazakhstan
Native/Alaskan
Median Family Income
Median Family Income Comparison
Immigrants from Kazakhstan
Natives/Alaskans
$110,137
MEDIAN FAMILY INCOME
97.8/ 100
METRIC RATING
93rd/ 347
METRIC RANK
$80,908
MEDIAN FAMILY INCOME
0.0/ 100
METRIC RATING
332nd/ 347
METRIC RANK
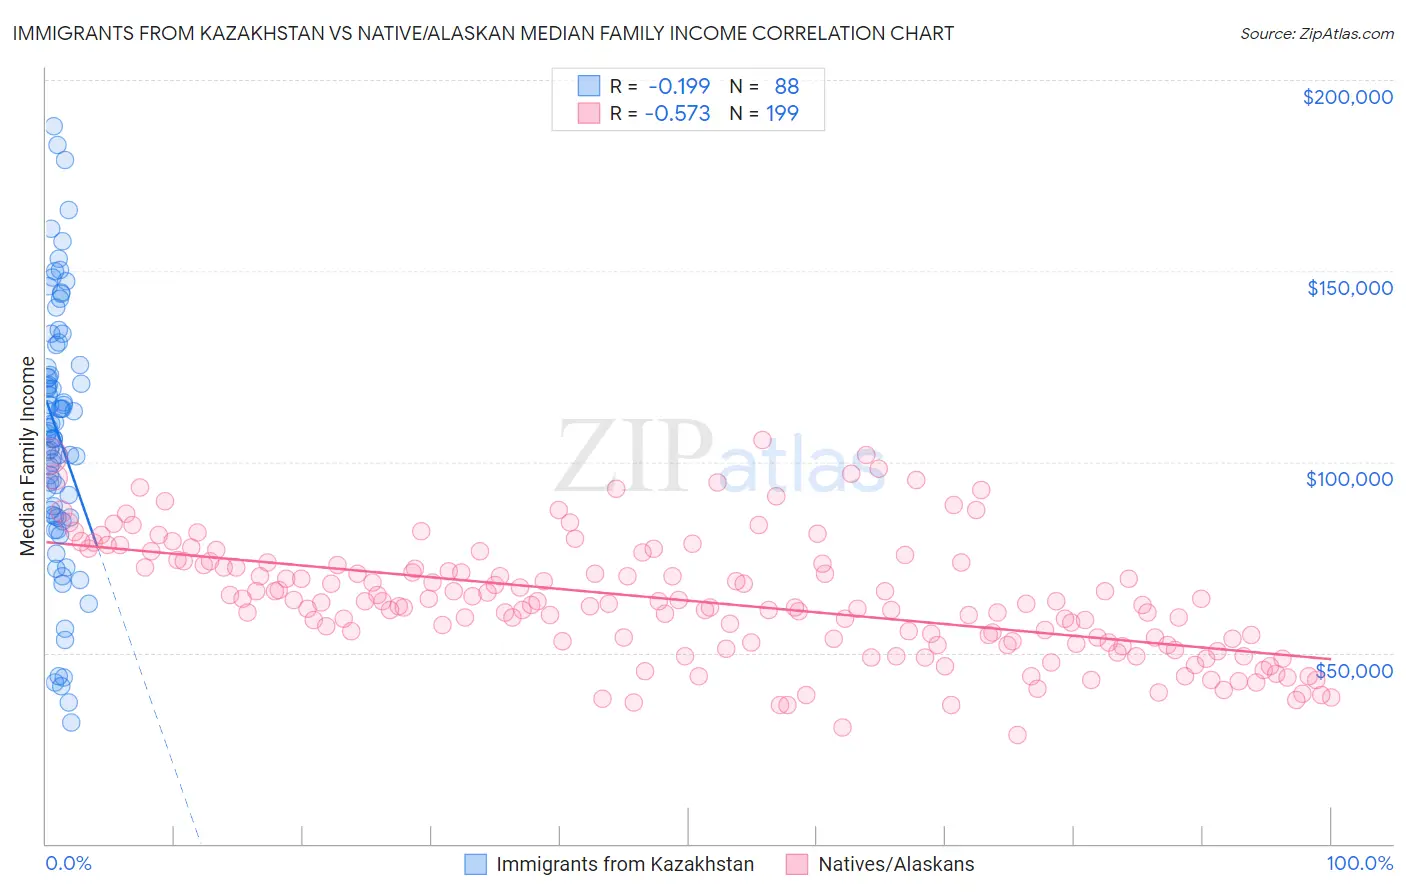
Immigrants from Kazakhstan vs Native/Alaskan Median Family Income Correlation Chart
The statistical analysis conducted on geographies consisting of 124,424,095 people shows a poor negative correlation between the proportion of Immigrants from Kazakhstan and median family income in the United States with a correlation coefficient (R) of -0.199 and weighted average of $110,137. Similarly, the statistical analysis conducted on geographies consisting of 512,223,526 people shows a substantial negative correlation between the proportion of Natives/Alaskans and median family income in the United States with a correlation coefficient (R) of -0.573 and weighted average of $80,908, a difference of 36.1%.
Median Family Income Correlation Summary
| Measurement | Immigrants from Kazakhstan | Native/Alaskan |
| Minimum | $31,653 | $28,542 |
| Maximum | $187,745 | $105,692 |
| Range | $156,092 | $77,150 |
| Mean | $107,291 | $63,631 |
| Median | $107,620 | $62,694 |
| Interquartile 25% (IQ1) | $85,937 | $52,723 |
| Interquartile 75% (IQ3) | $125,121 | $73,193 |
| Interquartile Range (IQR) | $39,184 | $20,470 |
| Standard Deviation (Sample) | $33,362 | $15,516 |
| Standard Deviation (Population) | $33,172 | $15,477 |
Similar Demographics by Median Family Income
Demographics Similar to Immigrants from Kazakhstan by Median Family Income
In terms of median family income, the demographic groups most similar to Immigrants from Kazakhstan are Immigrants from Lebanon ($110,159, a difference of 0.020%), Korean ($110,103, a difference of 0.030%), Zimbabwean ($110,011, a difference of 0.11%), Immigrants from Moldova ($109,975, a difference of 0.15%), and Jordanian ($109,865, a difference of 0.25%).
| Demographics | Rating | Rank | Median Family Income |
| Ukrainians | 98.8 /100 | #86 | Exceptional $111,368 |
| Austrians | 98.8 /100 | #87 | Exceptional $111,306 |
| Romanians | 98.8 /100 | #88 | Exceptional $111,243 |
| Immigrants | Argentina | 98.5 /100 | #89 | Exceptional $110,873 |
| Northern Europeans | 98.3 /100 | #90 | Exceptional $110,635 |
| Immigrants | Southern Europe | 98.3 /100 | #91 | Exceptional $110,614 |
| Immigrants | Lebanon | 97.9 /100 | #92 | Exceptional $110,159 |
| Immigrants | Kazakhstan | 97.8 /100 | #93 | Exceptional $110,137 |
| Koreans | 97.8 /100 | #94 | Exceptional $110,103 |
| Zimbabweans | 97.7 /100 | #95 | Exceptional $110,011 |
| Immigrants | Moldova | 97.7 /100 | #96 | Exceptional $109,975 |
| Jordanians | 97.5 /100 | #97 | Exceptional $109,865 |
| Immigrants | Kuwait | 97.4 /100 | #98 | Exceptional $109,731 |
| Armenians | 97.3 /100 | #99 | Exceptional $109,692 |
| Macedonians | 97.3 /100 | #100 | Exceptional $109,668 |
Demographics Similar to Natives/Alaskans by Median Family Income
In terms of median family income, the demographic groups most similar to Natives/Alaskans are Kiowa ($80,885, a difference of 0.030%), Immigrants from Dominican Republic ($81,233, a difference of 0.40%), Cheyenne ($81,385, a difference of 0.59%), Dutch West Indian ($81,852, a difference of 1.2%), and Black/African American ($81,912, a difference of 1.2%).
| Demographics | Rating | Rank | Median Family Income |
| Sioux | 0.0 /100 | #325 | Tragic $82,386 |
| Immigrants | Congo | 0.0 /100 | #326 | Tragic $82,216 |
| Arapaho | 0.0 /100 | #327 | Tragic $82,064 |
| Blacks/African Americans | 0.0 /100 | #328 | Tragic $81,912 |
| Dutch West Indians | 0.0 /100 | #329 | Tragic $81,852 |
| Cheyenne | 0.0 /100 | #330 | Tragic $81,385 |
| Immigrants | Dominican Republic | 0.0 /100 | #331 | Tragic $81,233 |
| Natives/Alaskans | 0.0 /100 | #332 | Tragic $80,908 |
| Kiowa | 0.0 /100 | #333 | Tragic $80,885 |
| Menominee | 0.0 /100 | #334 | Tragic $79,563 |
| Yup'ik | 0.0 /100 | #335 | Tragic $79,290 |
| Immigrants | Cuba | 0.0 /100 | #336 | Tragic $78,249 |
| Yuman | 0.0 /100 | #337 | Tragic $78,055 |
| Immigrants | Yemen | 0.0 /100 | #338 | Tragic $77,457 |
| Pima | 0.0 /100 | #339 | Tragic $77,431 |