Immigrants from West Indies vs Liberian Per Capita Income
COMPARE
Immigrants from West Indies
Liberian
Per Capita Income
Per Capita Income Comparison
Immigrants from West Indies
Liberians
$40,763
PER CAPITA INCOME
3.7/ 100
METRIC RATING
234th/ 347
METRIC RANK
$38,780
PER CAPITA INCOME
0.4/ 100
METRIC RATING
268th/ 347
METRIC RANK
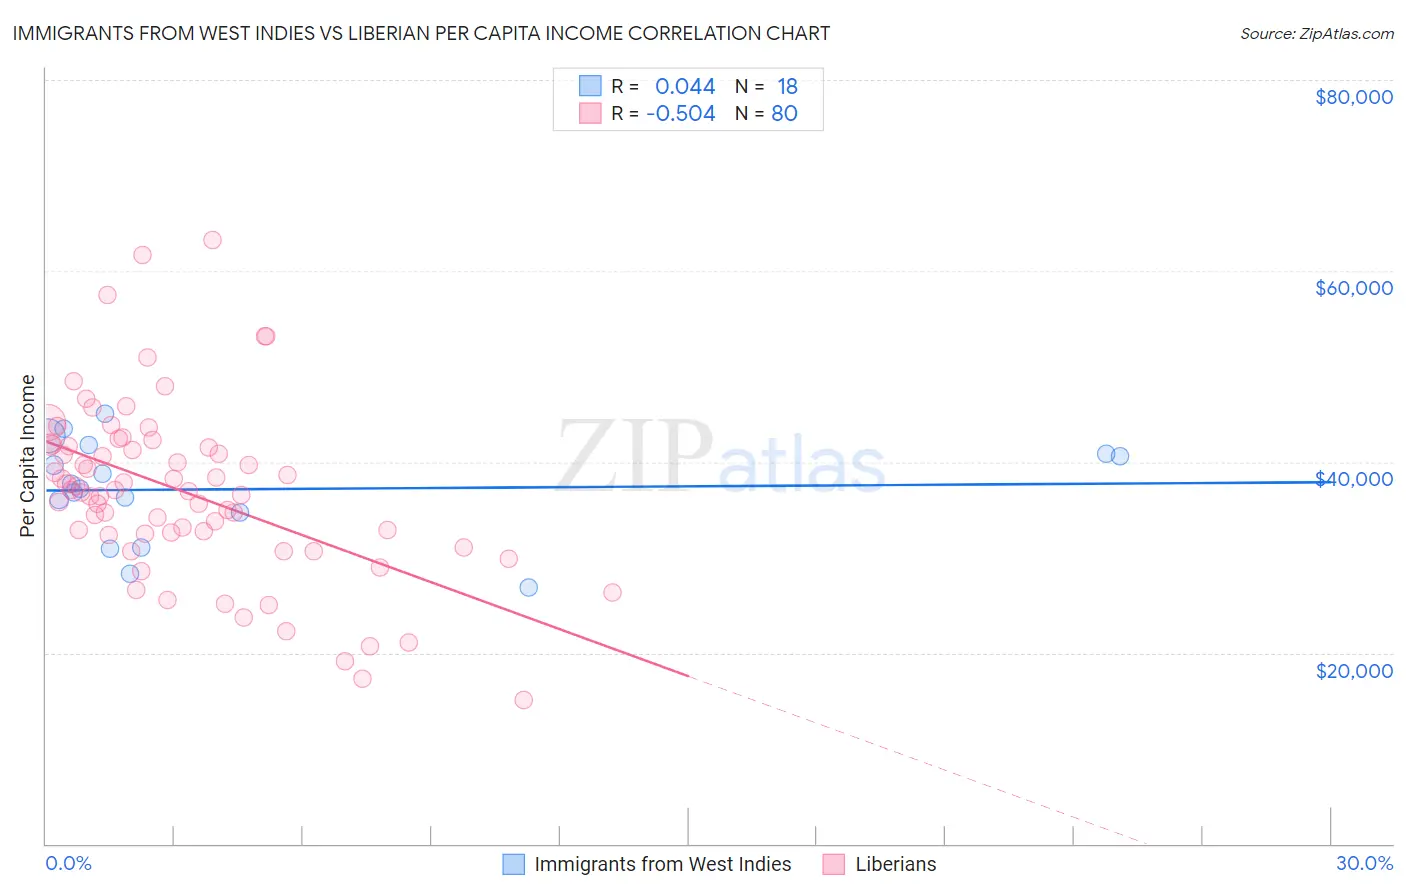
Immigrants from West Indies vs Liberian Per Capita Income Correlation Chart
The statistical analysis conducted on geographies consisting of 72,420,477 people shows no correlation between the proportion of Immigrants from West Indies and per capita income in the United States with a correlation coefficient (R) of 0.044 and weighted average of $40,763. Similarly, the statistical analysis conducted on geographies consisting of 118,107,140 people shows a substantial negative correlation between the proportion of Liberians and per capita income in the United States with a correlation coefficient (R) of -0.504 and weighted average of $38,780, a difference of 5.1%.
Per Capita Income Correlation Summary
| Measurement | Immigrants from West Indies | Liberian |
| Minimum | $26,894 | $15,041 |
| Maximum | $45,008 | $63,224 |
| Range | $18,114 | $48,183 |
| Mean | $37,133 | $36,863 |
| Median | $37,421 | $37,001 |
| Interquartile 25% (IQ1) | $34,659 | $32,406 |
| Interquartile 75% (IQ3) | $40,860 | $41,709 |
| Interquartile Range (IQR) | $6,201 | $9,304 |
| Standard Deviation (Sample) | $5,188 | $9,178 |
| Standard Deviation (Population) | $5,042 | $9,120 |
Similar Demographics by Per Capita Income
Demographics Similar to Immigrants from West Indies by Per Capita Income
In terms of per capita income, the demographic groups most similar to Immigrants from West Indies are Delaware ($40,778, a difference of 0.040%), Immigrants from Guyana ($40,742, a difference of 0.050%), Nonimmigrants ($40,669, a difference of 0.23%), Guyanese ($40,949, a difference of 0.46%), and Senegalese ($41,000, a difference of 0.58%).
| Demographics | Rating | Rank | Per Capita Income |
| Immigrants | Ghana | 5.5 /100 | #227 | Tragic $41,131 |
| Immigrants | Grenada | 5.5 /100 | #228 | Tragic $41,123 |
| Nigerians | 4.9 /100 | #229 | Tragic $41,026 |
| Native Hawaiians | 4.9 /100 | #230 | Tragic $41,017 |
| Senegalese | 4.8 /100 | #231 | Tragic $41,000 |
| Guyanese | 4.5 /100 | #232 | Tragic $40,949 |
| Delaware | 3.8 /100 | #233 | Tragic $40,778 |
| Immigrants | West Indies | 3.7 /100 | #234 | Tragic $40,763 |
| Immigrants | Guyana | 3.6 /100 | #235 | Tragic $40,742 |
| Immigrants | Nonimmigrants | 3.4 /100 | #236 | Tragic $40,669 |
| Immigrants | Cambodia | 2.6 /100 | #237 | Tragic $40,434 |
| Somalis | 2.4 /100 | #238 | Tragic $40,367 |
| Tsimshian | 2.4 /100 | #239 | Tragic $40,344 |
| Immigrants | Nigeria | 2.3 /100 | #240 | Tragic $40,339 |
| British West Indians | 2.3 /100 | #241 | Tragic $40,330 |
Demographics Similar to Liberians by Per Capita Income
In terms of per capita income, the demographic groups most similar to Liberians are Immigrants from Jamaica ($38,766, a difference of 0.040%), Immigrants from Zaire ($38,848, a difference of 0.17%), Salvadoran ($38,858, a difference of 0.20%), Immigrants from Belize ($38,614, a difference of 0.43%), and Central American ($38,560, a difference of 0.57%).
| Demographics | Rating | Rank | Per Capita Income |
| Marshallese | 0.6 /100 | #261 | Tragic $39,108 |
| Iroquois | 0.6 /100 | #262 | Tragic $39,104 |
| Belizeans | 0.6 /100 | #263 | Tragic $39,097 |
| Americans | 0.6 /100 | #264 | Tragic $39,039 |
| Spanish Americans | 0.5 /100 | #265 | Tragic $39,012 |
| Salvadorans | 0.5 /100 | #266 | Tragic $38,858 |
| Immigrants | Zaire | 0.4 /100 | #267 | Tragic $38,848 |
| Liberians | 0.4 /100 | #268 | Tragic $38,780 |
| Immigrants | Jamaica | 0.4 /100 | #269 | Tragic $38,766 |
| Immigrants | Belize | 0.3 /100 | #270 | Tragic $38,614 |
| Central Americans | 0.3 /100 | #271 | Tragic $38,560 |
| Immigrants | Cabo Verde | 0.3 /100 | #272 | Tragic $38,540 |
| Nepalese | 0.3 /100 | #273 | Tragic $38,442 |
| Immigrants | El Salvador | 0.3 /100 | #274 | Tragic $38,394 |
| Immigrants | Liberia | 0.2 /100 | #275 | Tragic $38,165 |