Ukrainian vs Peruvian Householder Income Ages 25 - 44 years
COMPARE
Ukrainian
Peruvian
Householder Income Ages 25 - 44 years
Householder Income Ages 25 - 44 years Comparison
Ukrainians
Peruvians
$102,451
HOUSEHOLDER INCOME AGES 25 - 44 YEARS
98.8/ 100
METRIC RATING
90th/ 347
METRIC RANK
$98,886
HOUSEHOLDER INCOME AGES 25 - 44 YEARS
91.7/ 100
METRIC RATING
121st/ 347
METRIC RANK
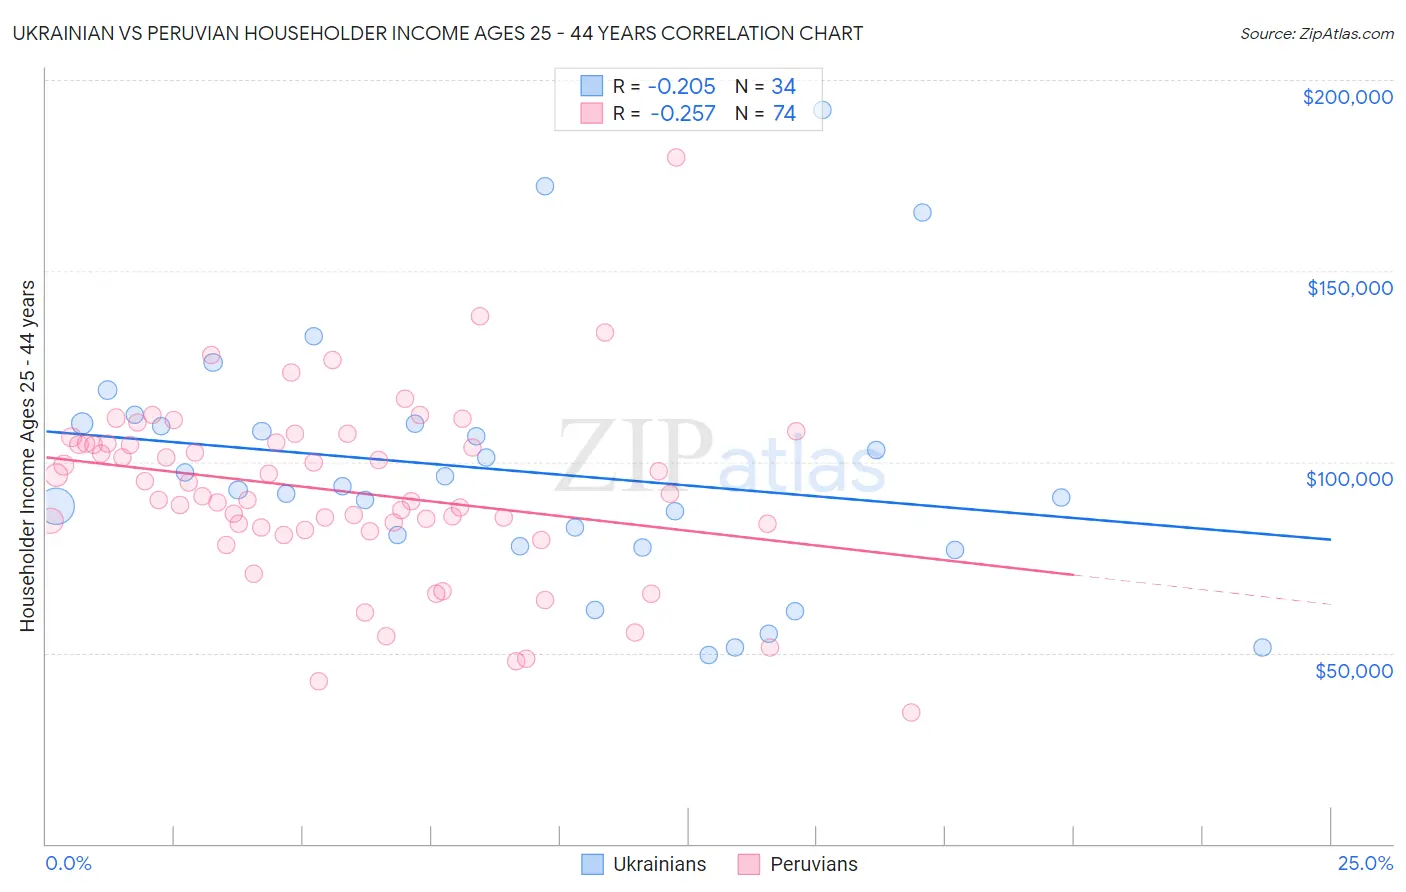
Ukrainian vs Peruvian Householder Income Ages 25 - 44 years Correlation Chart
The statistical analysis conducted on geographies consisting of 446,911,456 people shows a weak negative correlation between the proportion of Ukrainians and household income with householder between the ages 25 and 44 in the United States with a correlation coefficient (R) of -0.205 and weighted average of $102,451. Similarly, the statistical analysis conducted on geographies consisting of 362,388,350 people shows a weak negative correlation between the proportion of Peruvians and household income with householder between the ages 25 and 44 in the United States with a correlation coefficient (R) of -0.257 and weighted average of $98,886, a difference of 3.6%.
Householder Income Ages 25 - 44 years Correlation Summary
| Measurement | Ukrainian | Peruvian |
| Minimum | $49,533 | $34,268 |
| Maximum | $192,200 | $179,830 |
| Range | $142,666 | $145,562 |
| Mean | $97,681 | $92,331 |
| Median | $93,249 | $91,247 |
| Interquartile 25% (IQ1) | $77,819 | $82,833 |
| Interquartile 75% (IQ3) | $109,920 | $104,839 |
| Interquartile Range (IQR) | $32,101 | $22,006 |
| Standard Deviation (Sample) | $32,854 | $23,482 |
| Standard Deviation (Population) | $32,367 | $23,323 |
Similar Demographics by Householder Income Ages 25 - 44 years
Demographics Similar to Ukrainians by Householder Income Ages 25 - 44 years
In terms of householder income ages 25 - 44 years, the demographic groups most similar to Ukrainians are Croatian ($102,414, a difference of 0.040%), Immigrants from North America ($102,407, a difference of 0.040%), Romanian ($102,544, a difference of 0.090%), Immigrants from Canada ($102,616, a difference of 0.16%), and Immigrants from Hungary ($102,655, a difference of 0.20%).
| Demographics | Rating | Rank | Householder Income Ages 25 - 44 years |
| Argentineans | 99.1 /100 | #83 | Exceptional $103,111 |
| Immigrants | Philippines | 99.0 /100 | #84 | Exceptional $102,910 |
| Immigrants | Ukraine | 98.9 /100 | #85 | Exceptional $102,664 |
| Immigrants | Hungary | 98.9 /100 | #86 | Exceptional $102,655 |
| Immigrants | Western Europe | 98.9 /100 | #87 | Exceptional $102,654 |
| Immigrants | Canada | 98.9 /100 | #88 | Exceptional $102,616 |
| Romanians | 98.8 /100 | #89 | Exceptional $102,544 |
| Ukrainians | 98.8 /100 | #90 | Exceptional $102,451 |
| Croatians | 98.7 /100 | #91 | Exceptional $102,414 |
| Immigrants | North America | 98.7 /100 | #92 | Exceptional $102,407 |
| Immigrants | England | 98.4 /100 | #93 | Exceptional $102,020 |
| Sri Lankans | 98.4 /100 | #94 | Exceptional $101,960 |
| Assyrians/Chaldeans/Syriacs | 98.3 /100 | #95 | Exceptional $101,936 |
| Macedonians | 98.3 /100 | #96 | Exceptional $101,882 |
| Austrians | 98.3 /100 | #97 | Exceptional $101,842 |
Demographics Similar to Peruvians by Householder Income Ages 25 - 44 years
In terms of householder income ages 25 - 44 years, the demographic groups most similar to Peruvians are Immigrants from Uzbekistan ($98,849, a difference of 0.040%), Palestinian ($98,777, a difference of 0.11%), Swedish ($99,136, a difference of 0.25%), Jordanian ($99,186, a difference of 0.30%), and Zimbabwean ($98,586, a difference of 0.30%).
| Demographics | Rating | Rank | Householder Income Ages 25 - 44 years |
| Immigrants | Western Asia | 94.0 /100 | #114 | Exceptional $99,516 |
| Carpatho Rusyns | 93.7 /100 | #115 | Exceptional $99,449 |
| Portuguese | 93.7 /100 | #116 | Exceptional $99,429 |
| Immigrants | Northern Africa | 93.0 /100 | #117 | Exceptional $99,232 |
| Syrians | 92.9 /100 | #118 | Exceptional $99,215 |
| Jordanians | 92.8 /100 | #119 | Exceptional $99,186 |
| Swedes | 92.7 /100 | #120 | Exceptional $99,136 |
| Peruvians | 91.7 /100 | #121 | Exceptional $98,886 |
| Immigrants | Uzbekistan | 91.5 /100 | #122 | Exceptional $98,849 |
| Palestinians | 91.2 /100 | #123 | Exceptional $98,777 |
| Zimbabweans | 90.3 /100 | #124 | Exceptional $98,586 |
| Pakistanis | 89.3 /100 | #125 | Excellent $98,401 |
| British | 89.1 /100 | #126 | Excellent $98,359 |
| Serbians | 88.9 /100 | #127 | Excellent $98,320 |
| Europeans | 88.9 /100 | #128 | Excellent $98,310 |