Immigrants from Eastern Asia vs Cypriot Median Male Earnings
COMPARE
Immigrants from Eastern Asia
Cypriot
Median Male Earnings
Median Male Earnings Comparison
Immigrants from Eastern Asia
Cypriots
$66,903
MEDIAN MALE EARNINGS
100.0/ 100
METRIC RATING
15th/ 347
METRIC RANK
$65,549
MEDIAN MALE EARNINGS
100.0/ 100
METRIC RATING
19th/ 347
METRIC RANK
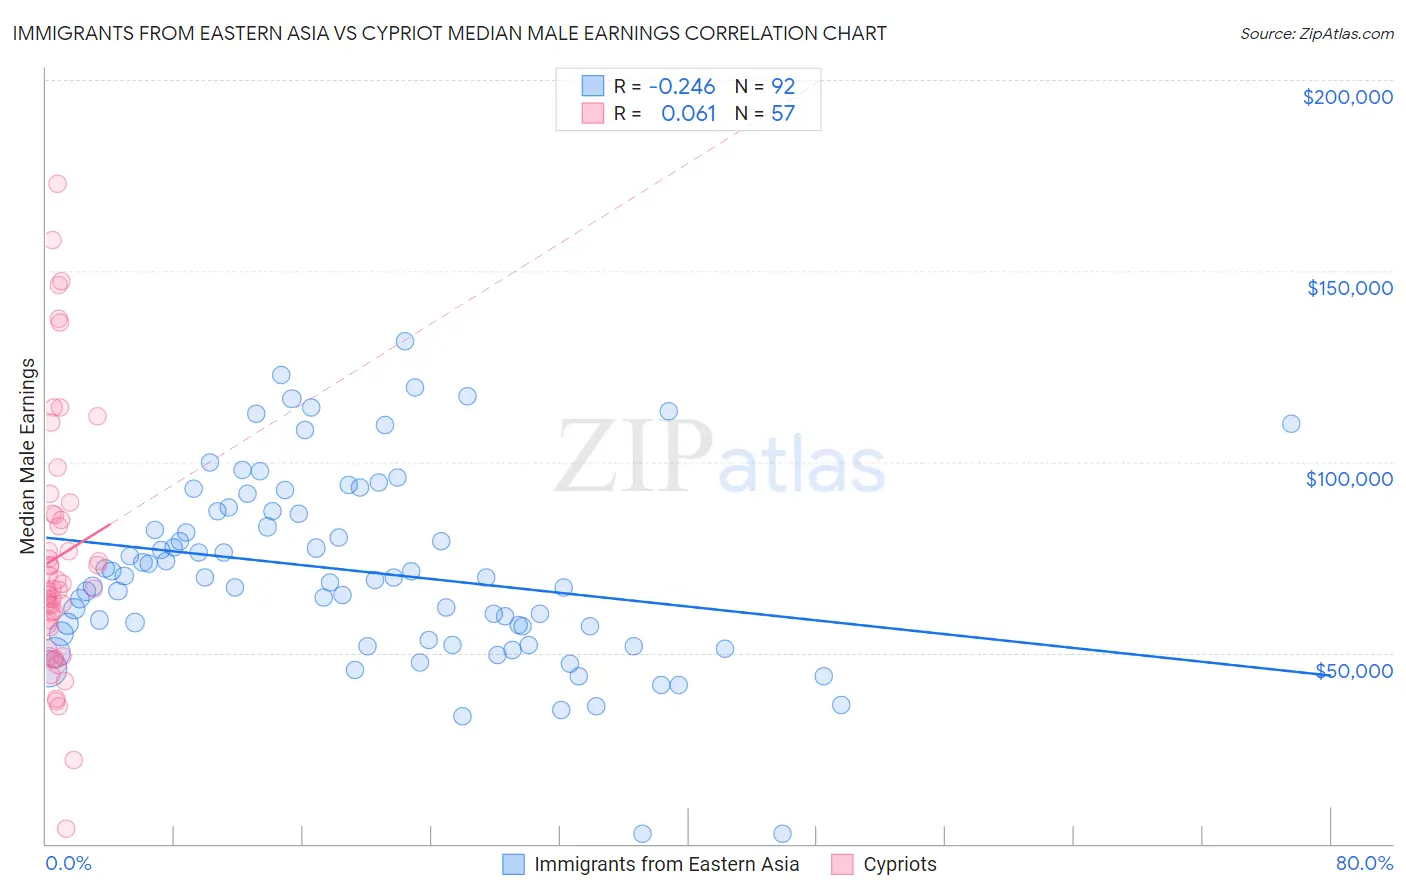
Immigrants from Eastern Asia vs Cypriot Median Male Earnings Correlation Chart
The statistical analysis conducted on geographies consisting of 499,639,394 people shows a weak negative correlation between the proportion of Immigrants from Eastern Asia and median male earnings in the United States with a correlation coefficient (R) of -0.246 and weighted average of $66,903. Similarly, the statistical analysis conducted on geographies consisting of 61,867,128 people shows a slight positive correlation between the proportion of Cypriots and median male earnings in the United States with a correlation coefficient (R) of 0.061 and weighted average of $65,549, a difference of 2.1%.
Median Male Earnings Correlation Summary
| Measurement | Immigrants from Eastern Asia | Cypriot |
| Minimum | $2,499 | $3,864 |
| Maximum | $131,653 | $172,778 |
| Range | $129,154 | $168,914 |
| Mean | $71,397 | $75,157 |
| Median | $69,591 | $66,784 |
| Interquartile 25% (IQ1) | $54,279 | $56,985 |
| Interquartile 75% (IQ3) | $87,124 | $86,286 |
| Interquartile Range (IQR) | $32,845 | $29,301 |
| Standard Deviation (Sample) | $24,831 | $33,466 |
| Standard Deviation (Population) | $24,695 | $33,171 |
Demographics Similar to Immigrants from Eastern Asia and Cypriots by Median Male Earnings
In terms of median male earnings, the demographic groups most similar to Immigrants from Eastern Asia are Okinawan ($67,232, a difference of 0.49%), Eastern European ($66,472, a difference of 0.65%), Immigrants from China ($67,353, a difference of 0.67%), Immigrants from Australia ($67,634, a difference of 1.1%), and Immigrants from Belgium ($66,125, a difference of 1.2%). Similarly, the demographic groups most similar to Cypriots are Immigrants from Japan ($65,518, a difference of 0.050%), Immigrants from Sweden ($65,406, a difference of 0.22%), Burmese ($65,236, a difference of 0.48%), Immigrants from Korea ($65,079, a difference of 0.72%), and Indian (Asian) ($66,078, a difference of 0.81%).
| Demographics | Rating | Rank | Median Male Earnings |
| Immigrants | Hong Kong | 100.0 /100 | #7 | Exceptional $70,146 |
| Immigrants | Iran | 100.0 /100 | #8 | Exceptional $69,284 |
| Immigrants | South Central Asia | 100.0 /100 | #9 | Exceptional $68,960 |
| Immigrants | Israel | 100.0 /100 | #10 | Exceptional $68,716 |
| Immigrants | Ireland | 100.0 /100 | #11 | Exceptional $67,698 |
| Immigrants | Australia | 100.0 /100 | #12 | Exceptional $67,634 |
| Immigrants | China | 100.0 /100 | #13 | Exceptional $67,353 |
| Okinawans | 100.0 /100 | #14 | Exceptional $67,232 |
| Immigrants | Eastern Asia | 100.0 /100 | #15 | Exceptional $66,903 |
| Eastern Europeans | 100.0 /100 | #16 | Exceptional $66,472 |
| Immigrants | Belgium | 100.0 /100 | #17 | Exceptional $66,125 |
| Indians (Asian) | 100.0 /100 | #18 | Exceptional $66,078 |
| Cypriots | 100.0 /100 | #19 | Exceptional $65,549 |
| Immigrants | Japan | 100.0 /100 | #20 | Exceptional $65,518 |
| Immigrants | Sweden | 100.0 /100 | #21 | Exceptional $65,406 |
| Burmese | 100.0 /100 | #22 | Exceptional $65,236 |
| Immigrants | Korea | 100.0 /100 | #23 | Exceptional $65,079 |
| Immigrants | Northern Europe | 100.0 /100 | #24 | Exceptional $64,987 |
| Immigrants | Denmark | 100.0 /100 | #25 | Exceptional $64,625 |
| Turks | 100.0 /100 | #26 | Exceptional $64,253 |
| Immigrants | Switzerland | 100.0 /100 | #27 | Exceptional $63,944 |