Ukrainian vs Cypriot Family Households
COMPARE
Ukrainian
Cypriot
Family Households
Family Households Comparison
Ukrainians
Cypriots
64.2%
FAMILY HOUSEHOLDS
34.6/ 100
METRIC RATING
182nd/ 347
METRIC RANK
63.2%
FAMILY HOUSEHOLDS
0.6/ 100
METRIC RATING
260th/ 347
METRIC RANK
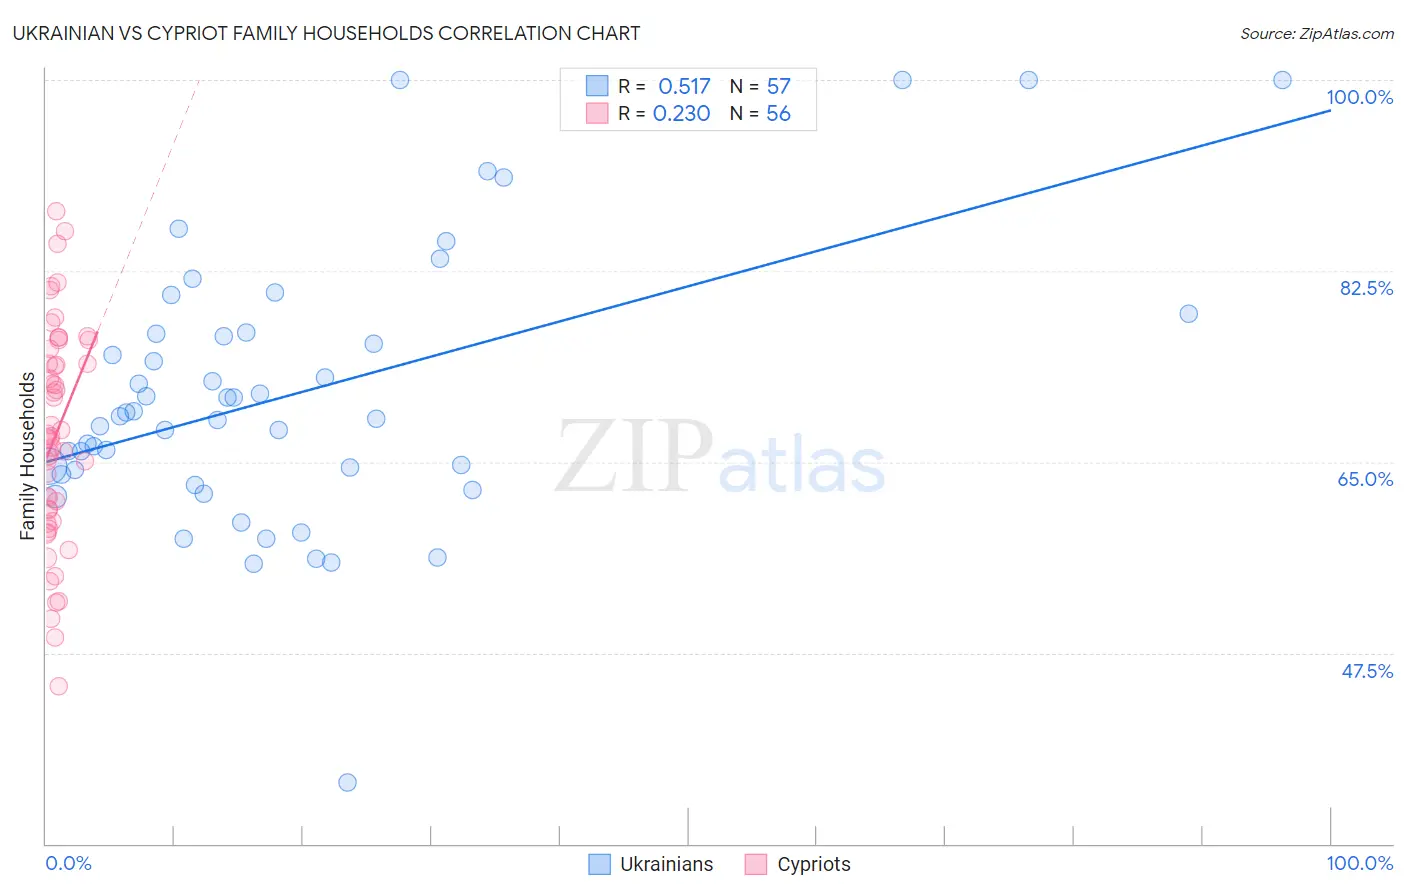
Ukrainian vs Cypriot Family Households Correlation Chart
The statistical analysis conducted on geographies consisting of 448,323,660 people shows a substantial positive correlation between the proportion of Ukrainians and percentage of family households in the United States with a correlation coefficient (R) of 0.517 and weighted average of 64.2%. Similarly, the statistical analysis conducted on geographies consisting of 61,857,015 people shows a weak positive correlation between the proportion of Cypriots and percentage of family households in the United States with a correlation coefficient (R) of 0.230 and weighted average of 63.2%, a difference of 1.5%.
Family Households Correlation Summary
| Measurement | Ukrainian | Cypriot |
| Minimum | 35.6% | 44.4% |
| Maximum | 100.0% | 87.9% |
| Range | 64.4% | 43.5% |
| Mean | 71.3% | 67.4% |
| Median | 69.2% | 67.3% |
| Interquartile 25% (IQ1) | 64.0% | 60.0% |
| Interquartile 75% (IQ3) | 76.8% | 74.7% |
| Interquartile Range (IQR) | 12.8% | 14.7% |
| Standard Deviation (Sample) | 12.5% | 9.9% |
| Standard Deviation (Population) | 12.4% | 9.8% |
Similar Demographics by Family Households
Demographics Similar to Ukrainians by Family Households
In terms of family households, the demographic groups most similar to Ukrainians are Immigrants from Honduras (64.2%, a difference of 0.0%), Immigrants from Trinidad and Tobago (64.2%, a difference of 0.0%), Creek (64.2%, a difference of 0.010%), Puerto Rican (64.2%, a difference of 0.020%), and Immigrants from Ukraine (64.2%, a difference of 0.050%).
| Demographics | Rating | Rank | Family Households |
| Bangladeshis | 44.3 /100 | #175 | Average 64.3% |
| Vietnamese | 43.6 /100 | #176 | Average 64.2% |
| Immigrants | Micronesia | 42.3 /100 | #177 | Average 64.2% |
| Jamaicans | 40.6 /100 | #178 | Average 64.2% |
| Immigrants | Ukraine | 38.2 /100 | #179 | Fair 64.2% |
| Immigrants | Honduras | 35.0 /100 | #180 | Fair 64.2% |
| Immigrants | Trinidad and Tobago | 34.9 /100 | #181 | Fair 64.2% |
| Ukrainians | 34.6 /100 | #182 | Fair 64.2% |
| Creek | 34.1 /100 | #183 | Fair 64.2% |
| Puerto Ricans | 33.4 /100 | #184 | Fair 64.2% |
| Immigrants | Iran | 30.4 /100 | #185 | Fair 64.1% |
| Spanish Americans | 30.1 /100 | #186 | Fair 64.1% |
| Northern Europeans | 28.2 /100 | #187 | Fair 64.1% |
| Paraguayans | 26.7 /100 | #188 | Fair 64.1% |
| Immigrants | Western Asia | 25.3 /100 | #189 | Fair 64.1% |
Demographics Similar to Cypriots by Family Households
In terms of family households, the demographic groups most similar to Cypriots are Immigrants from Western Europe (63.2%, a difference of 0.020%), Immigrants from Russia (63.2%, a difference of 0.020%), Immigrants from Barbados (63.2%, a difference of 0.030%), Immigrants from Ireland (63.2%, a difference of 0.030%), and Cheyenne (63.2%, a difference of 0.050%).
| Demographics | Rating | Rank | Family Households |
| Immigrants | Dominican Republic | 1.0 /100 | #253 | Tragic 63.3% |
| Slovaks | 1.0 /100 | #254 | Tragic 63.3% |
| Potawatomi | 1.0 /100 | #255 | Tragic 63.3% |
| Luxembourgers | 0.9 /100 | #256 | Tragic 63.3% |
| Icelanders | 0.8 /100 | #257 | Tragic 63.3% |
| Immigrants | Barbados | 0.7 /100 | #258 | Tragic 63.2% |
| Immigrants | Western Europe | 0.6 /100 | #259 | Tragic 63.2% |
| Cypriots | 0.6 /100 | #260 | Tragic 63.2% |
| Immigrants | Russia | 0.6 /100 | #261 | Tragic 63.2% |
| Immigrants | Ireland | 0.6 /100 | #262 | Tragic 63.2% |
| Cheyenne | 0.5 /100 | #263 | Tragic 63.2% |
| Kenyans | 0.5 /100 | #264 | Tragic 63.2% |
| Colville | 0.5 /100 | #265 | Tragic 63.2% |
| Immigrants | Western Africa | 0.5 /100 | #266 | Tragic 63.1% |
| Israelis | 0.4 /100 | #267 | Tragic 63.1% |