Tsimshian vs Seminole Householder Income Over 65 years
COMPARE
Tsimshian
Seminole
Householder Income Over 65 years
Householder Income Over 65 years Comparison
Tsimshian
Seminole
$58,202
HOUSEHOLDER INCOME OVER 65 YEARS
5.2/ 100
METRIC RATING
223rd/ 347
METRIC RANK
$52,373
HOUSEHOLDER INCOME OVER 65 YEARS
0.0/ 100
METRIC RATING
311th/ 347
METRIC RANK
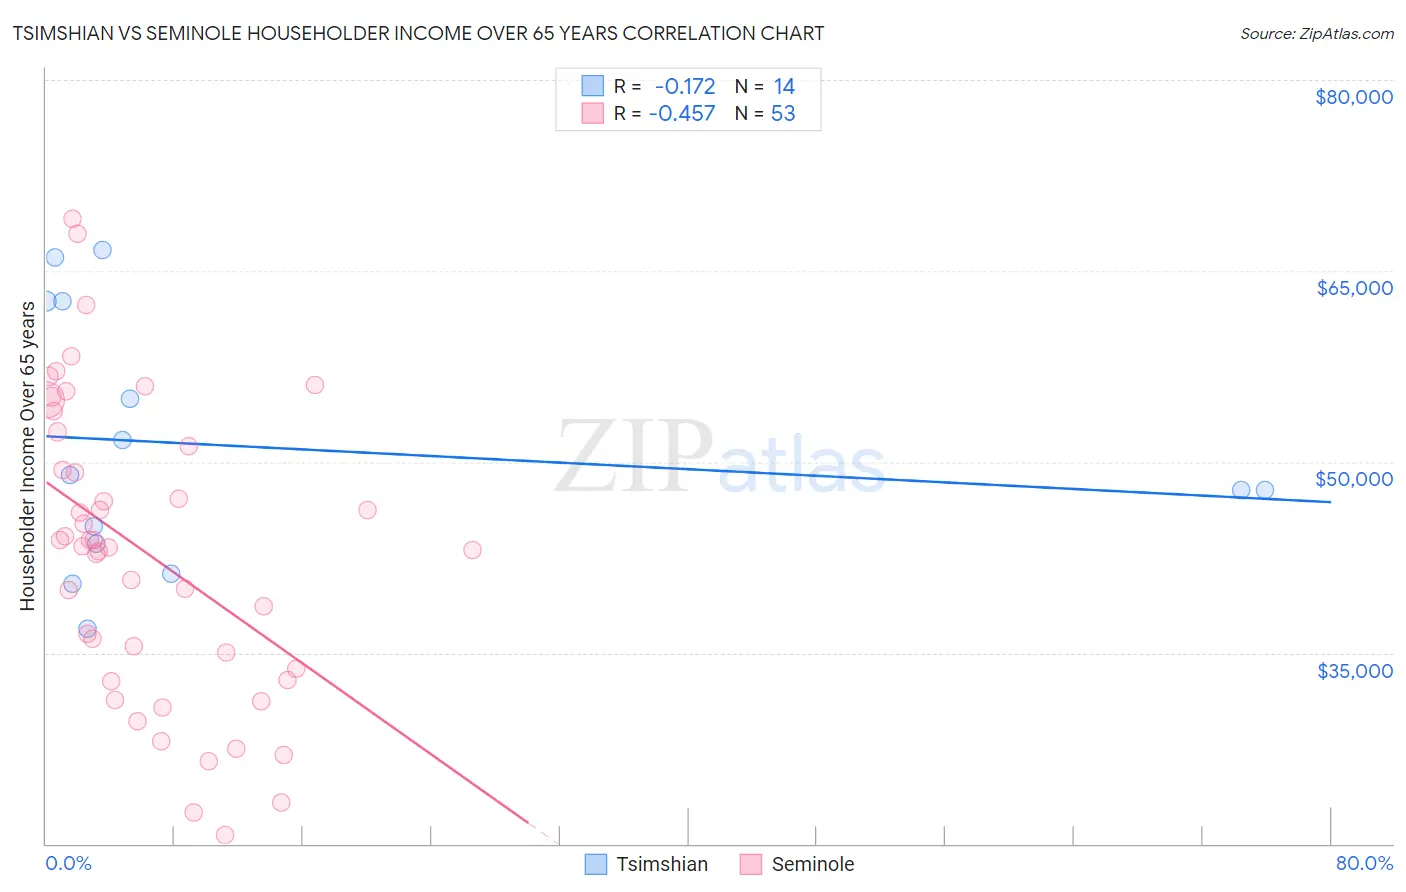
Tsimshian vs Seminole Householder Income Over 65 years Correlation Chart
The statistical analysis conducted on geographies consisting of 15,616,590 people shows a poor negative correlation between the proportion of Tsimshian and household income with householder over the age of 65 in the United States with a correlation coefficient (R) of -0.172 and weighted average of $58,202. Similarly, the statistical analysis conducted on geographies consisting of 118,149,941 people shows a moderate negative correlation between the proportion of Seminole and household income with householder over the age of 65 in the United States with a correlation coefficient (R) of -0.457 and weighted average of $52,373, a difference of 11.1%.
Householder Income Over 65 years Correlation Summary
| Measurement | Tsimshian | Seminole |
| Minimum | $36,937 | $20,714 |
| Maximum | $66,667 | $69,068 |
| Range | $29,730 | $48,354 |
| Mean | $51,164 | $42,904 |
| Median | $48,373 | $43,396 |
| Interquartile 25% (IQ1) | $43,571 | $33,309 |
| Interquartile 75% (IQ3) | $62,589 | $51,804 |
| Interquartile Range (IQR) | $19,018 | $18,495 |
| Standard Deviation (Sample) | $9,918 | $11,569 |
| Standard Deviation (Population) | $9,557 | $11,460 |
Similar Demographics by Householder Income Over 65 years
Demographics Similar to Tsimshian by Householder Income Over 65 years
In terms of householder income over 65 years, the demographic groups most similar to Tsimshian are Delaware ($58,214, a difference of 0.020%), Immigrants from El Salvador ($58,226, a difference of 0.040%), Bermudan ($58,171, a difference of 0.050%), Malaysian ($58,244, a difference of 0.070%), and Yugoslavian ($58,243, a difference of 0.070%).
| Demographics | Rating | Rank | Householder Income Over 65 years |
| Immigrants | Middle Africa | 6.2 /100 | #216 | Tragic $58,375 |
| Sudanese | 5.7 /100 | #217 | Tragic $58,281 |
| Panamanians | 5.6 /100 | #218 | Tragic $58,266 |
| Malaysians | 5.5 /100 | #219 | Tragic $58,244 |
| Yugoslavians | 5.5 /100 | #220 | Tragic $58,243 |
| Immigrants | El Salvador | 5.4 /100 | #221 | Tragic $58,226 |
| Delaware | 5.3 /100 | #222 | Tragic $58,214 |
| Tsimshian | 5.2 /100 | #223 | Tragic $58,202 |
| Bermudans | 5.1 /100 | #224 | Tragic $58,171 |
| Venezuelans | 4.4 /100 | #225 | Tragic $58,026 |
| French Canadians | 4.2 /100 | #226 | Tragic $57,975 |
| Japanese | 3.9 /100 | #227 | Tragic $57,919 |
| Immigrants | Albania | 3.6 /100 | #228 | Tragic $57,828 |
| Immigrants | Colombia | 3.0 /100 | #229 | Tragic $57,658 |
| Immigrants | Cambodia | 2.8 /100 | #230 | Tragic $57,580 |
Demographics Similar to Seminole by Householder Income Over 65 years
In terms of householder income over 65 years, the demographic groups most similar to Seminole are Sioux ($52,509, a difference of 0.26%), Immigrants from the Azores ($52,121, a difference of 0.48%), Honduran ($52,634, a difference of 0.50%), Immigrants from Nicaragua ($52,085, a difference of 0.55%), and Native/Alaskan ($52,081, a difference of 0.56%).
| Demographics | Rating | Rank | Householder Income Over 65 years |
| Ute | 0.0 /100 | #304 | Tragic $52,949 |
| Pueblo | 0.0 /100 | #305 | Tragic $52,930 |
| Pennsylvania Germans | 0.0 /100 | #306 | Tragic $52,888 |
| Hispanics or Latinos | 0.0 /100 | #307 | Tragic $52,832 |
| Immigrants | Mexico | 0.0 /100 | #308 | Tragic $52,801 |
| Hondurans | 0.0 /100 | #309 | Tragic $52,634 |
| Sioux | 0.0 /100 | #310 | Tragic $52,509 |
| Seminole | 0.0 /100 | #311 | Tragic $52,373 |
| Immigrants | Azores | 0.0 /100 | #312 | Tragic $52,121 |
| Immigrants | Nicaragua | 0.0 /100 | #313 | Tragic $52,085 |
| Natives/Alaskans | 0.0 /100 | #314 | Tragic $52,081 |
| U.S. Virgin Islanders | 0.0 /100 | #315 | Tragic $52,072 |
| Creek | 0.0 /100 | #316 | Tragic $51,949 |
| Immigrants | St. Vincent and the Grenadines | 0.0 /100 | #317 | Tragic $51,922 |
| Haitians | 0.0 /100 | #318 | Tragic $51,912 |