Tsimshian vs Bermudan Householder Income Ages 45 - 64 years
COMPARE
Tsimshian
Bermudan
Householder Income Ages 45 - 64 years
Householder Income Ages 45 - 64 years Comparison
Tsimshian
Bermudans
$96,783
HOUSEHOLDER INCOME AGES 45 - 64 YEARS
14.5/ 100
METRIC RATING
210th/ 347
METRIC RANK
$94,197
HOUSEHOLDER INCOME AGES 45 - 64 YEARS
4.4/ 100
METRIC RATING
225th/ 347
METRIC RANK
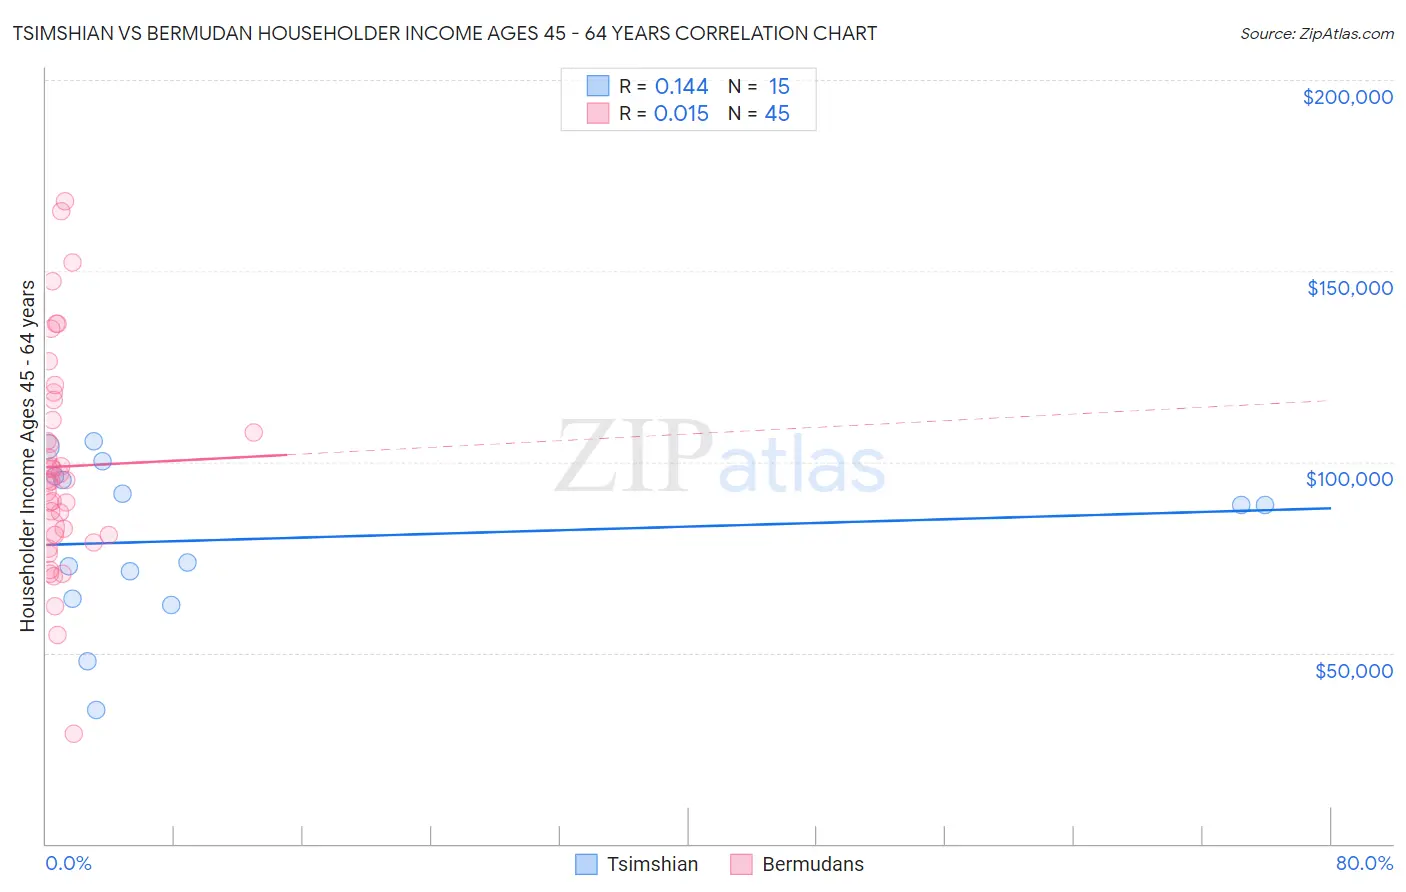
Tsimshian vs Bermudan Householder Income Ages 45 - 64 years Correlation Chart
The statistical analysis conducted on geographies consisting of 15,616,673 people shows a poor positive correlation between the proportion of Tsimshian and household income with householder between the ages 45 and 64 in the United States with a correlation coefficient (R) of 0.144 and weighted average of $96,783. Similarly, the statistical analysis conducted on geographies consisting of 55,700,140 people shows no correlation between the proportion of Bermudans and household income with householder between the ages 45 and 64 in the United States with a correlation coefficient (R) of 0.015 and weighted average of $94,197, a difference of 2.8%.
Householder Income Ages 45 - 64 years Correlation Summary
| Measurement | Tsimshian | Bermudan |
| Minimum | $35,000 | $28,750 |
| Maximum | $105,417 | $168,207 |
| Range | $70,417 | $139,457 |
| Mean | $79,823 | $98,773 |
| Median | $88,750 | $95,242 |
| Interquartile 25% (IQ1) | $64,063 | $80,989 |
| Interquartile 75% (IQ3) | $96,327 | $113,573 |
| Interquartile Range (IQR) | $32,264 | $32,583 |
| Standard Deviation (Sample) | $21,070 | $28,344 |
| Standard Deviation (Population) | $20,355 | $28,027 |
Demographics Similar to Tsimshian and Bermudans by Householder Income Ages 45 - 64 years
In terms of householder income ages 45 - 64 years, the demographic groups most similar to Tsimshian are Japanese ($96,834, a difference of 0.050%), Immigrants from Cambodia ($96,537, a difference of 0.26%), Scotch-Irish ($97,073, a difference of 0.30%), Venezuelan ($96,460, a difference of 0.34%), and Ghanaian ($97,277, a difference of 0.51%). Similarly, the demographic groups most similar to Bermudans are Immigrants from the Azores ($94,138, a difference of 0.060%), Immigrants from Bosnia and Herzegovina ($94,288, a difference of 0.10%), Alaska Native ($93,991, a difference of 0.22%), Nonimmigrants ($94,448, a difference of 0.27%), and Malaysian ($94,517, a difference of 0.34%).
| Demographics | Rating | Rank | Householder Income Ages 45 - 64 years |
| Ghanaians | 17.9 /100 | #207 | Poor $97,277 |
| Scotch-Irish | 16.4 /100 | #208 | Poor $97,073 |
| Japanese | 14.8 /100 | #209 | Poor $96,834 |
| Tsimshian | 14.5 /100 | #210 | Poor $96,783 |
| Immigrants | Cambodia | 13.0 /100 | #211 | Poor $96,537 |
| Venezuelans | 12.6 /100 | #212 | Poor $96,460 |
| Immigrants | Uruguay | 10.7 /100 | #213 | Poor $96,086 |
| Panamanians | 10.6 /100 | #214 | Poor $96,066 |
| Nigerians | 8.2 /100 | #215 | Tragic $95,492 |
| Immigrants | Venezuela | 7.6 /100 | #216 | Tragic $95,342 |
| Immigrants | Ghana | 6.4 /100 | #217 | Tragic $94,982 |
| Delaware | 6.2 /100 | #218 | Tragic $94,914 |
| Immigrants | Armenia | 6.1 /100 | #219 | Tragic $94,863 |
| Salvadorans | 6.0 /100 | #220 | Tragic $94,842 |
| Immigrants | Nigeria | 5.9 /100 | #221 | Tragic $94,804 |
| Malaysians | 5.2 /100 | #222 | Tragic $94,517 |
| Immigrants | Nonimmigrants | 5.0 /100 | #223 | Tragic $94,448 |
| Immigrants | Bosnia and Herzegovina | 4.6 /100 | #224 | Tragic $94,288 |
| Bermudans | 4.4 /100 | #225 | Tragic $94,197 |
| Immigrants | Azores | 4.3 /100 | #226 | Tragic $94,138 |
| Alaska Natives | 4.0 /100 | #227 | Tragic $93,991 |