Immigrants from Hong Kong vs Houma Median Household Income
COMPARE
Immigrants from Hong Kong
Houma
Median Household Income
Median Household Income Comparison
Immigrants from Hong Kong
Houma
$111,519
MEDIAN HOUSEHOLD INCOME
100.0/ 100
METRIC RATING
4th/ 347
METRIC RANK
$62,575
MEDIAN HOUSEHOLD INCOME
0.0/ 100
METRIC RATING
343rd/ 347
METRIC RANK
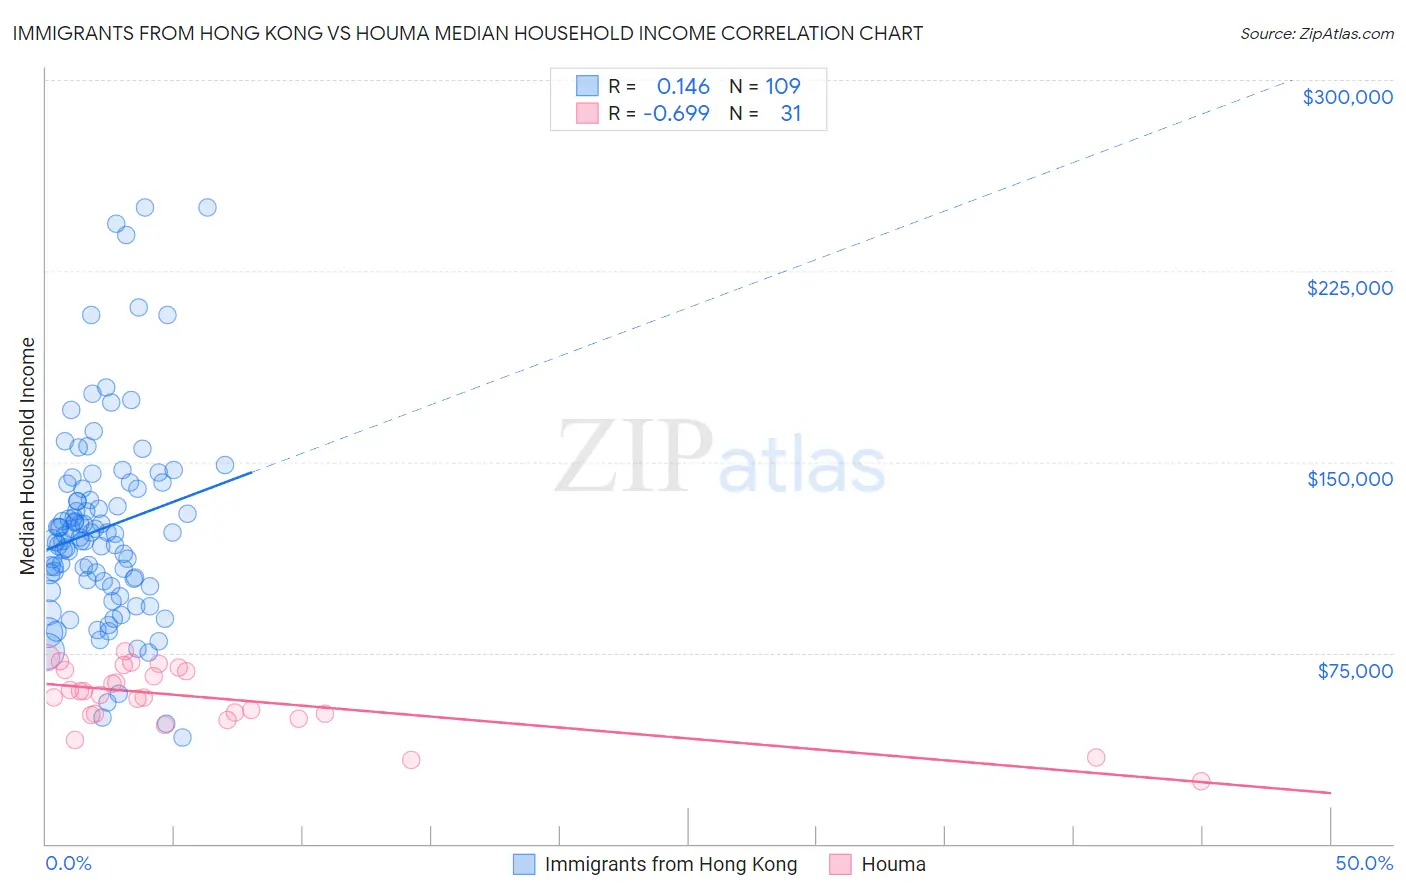
Immigrants from Hong Kong vs Houma Median Household Income Correlation Chart
The statistical analysis conducted on geographies consisting of 253,858,060 people shows a poor positive correlation between the proportion of Immigrants from Hong Kong and median household income in the United States with a correlation coefficient (R) of 0.146 and weighted average of $111,519. Similarly, the statistical analysis conducted on geographies consisting of 36,792,126 people shows a significant negative correlation between the proportion of Houma and median household income in the United States with a correlation coefficient (R) of -0.699 and weighted average of $62,575, a difference of 78.2%.
Median Household Income Correlation Summary
| Measurement | Immigrants from Hong Kong | Houma |
| Minimum | $41,563 | $24,706 |
| Maximum | $250,001 | $75,521 |
| Range | $208,438 | $50,815 |
| Mean | $123,651 | $57,222 |
| Median | $120,226 | $58,380 |
| Interquartile 25% (IQ1) | $102,101 | $50,766 |
| Interquartile 75% (IQ3) | $139,539 | $68,165 |
| Interquartile Range (IQR) | $37,437 | $17,398 |
| Standard Deviation (Sample) | $39,253 | $12,629 |
| Standard Deviation (Population) | $39,072 | $12,424 |
Similar Demographics by Median Household Income
Demographics Similar to Immigrants from Hong Kong by Median Household Income
In terms of median household income, the demographic groups most similar to Immigrants from Hong Kong are Thai ($110,648, a difference of 0.79%), Immigrants from Singapore ($110,428, a difference of 0.99%), Immigrants from India ($113,009, a difference of 1.3%), Iranian ($109,835, a difference of 1.5%), and Immigrants from Iran ($108,055, a difference of 3.2%).
| Demographics | Rating | Rank | Median Household Income |
| Immigrants | Taiwan | 100.0 /100 | #1 | Exceptional $116,460 |
| Filipinos | 100.0 /100 | #2 | Exceptional $115,509 |
| Immigrants | India | 100.0 /100 | #3 | Exceptional $113,009 |
| Immigrants | Hong Kong | 100.0 /100 | #4 | Exceptional $111,519 |
| Thais | 100.0 /100 | #5 | Exceptional $110,648 |
| Immigrants | Singapore | 100.0 /100 | #6 | Exceptional $110,428 |
| Iranians | 100.0 /100 | #7 | Exceptional $109,835 |
| Immigrants | Iran | 100.0 /100 | #8 | Exceptional $108,055 |
| Okinawans | 100.0 /100 | #9 | Exceptional $106,624 |
| Immigrants | South Central Asia | 100.0 /100 | #10 | Exceptional $106,057 |
| Immigrants | China | 100.0 /100 | #11 | Exceptional $105,335 |
| Indians (Asian) | 100.0 /100 | #12 | Exceptional $105,262 |
| Immigrants | Eastern Asia | 100.0 /100 | #13 | Exceptional $104,796 |
| Immigrants | Ireland | 100.0 /100 | #14 | Exceptional $104,692 |
| Immigrants | Israel | 100.0 /100 | #15 | Exceptional $104,090 |
Demographics Similar to Houma by Median Household Income
In terms of median household income, the demographic groups most similar to Houma are Pima ($63,262, a difference of 1.1%), Tohono O'odham ($61,663, a difference of 1.5%), Crow ($63,681, a difference of 1.8%), Pueblo ($64,692, a difference of 3.4%), and Hopi ($65,043, a difference of 3.9%).
| Demographics | Rating | Rank | Median Household Income |
| Creek | 0.0 /100 | #333 | Tragic $67,715 |
| Blacks/African Americans | 0.0 /100 | #334 | Tragic $67,573 |
| Cheyenne | 0.0 /100 | #335 | Tragic $66,974 |
| Immigrants | Congo | 0.0 /100 | #336 | Tragic $66,768 |
| Kiowa | 0.0 /100 | #337 | Tragic $65,914 |
| Immigrants | Yemen | 0.0 /100 | #338 | Tragic $65,194 |
| Hopi | 0.0 /100 | #339 | Tragic $65,043 |
| Pueblo | 0.0 /100 | #340 | Tragic $64,692 |
| Crow | 0.0 /100 | #341 | Tragic $63,681 |
| Pima | 0.0 /100 | #342 | Tragic $63,262 |
| Houma | 0.0 /100 | #343 | Tragic $62,575 |
| Tohono O'odham | 0.0 /100 | #344 | Tragic $61,663 |
| Puerto Ricans | 0.0 /100 | #345 | Tragic $59,197 |
| Navajo | 0.0 /100 | #346 | Tragic $59,159 |
| Lumbee | 0.0 /100 | #347 | Tragic $54,644 |