U.S. Virgin Islander vs Houma Median Household Income
COMPARE
U.S. Virgin Islander
Houma
Median Household Income
Median Household Income Comparison
U.S. Virgin Islanders
Houma
$71,853
MEDIAN HOUSEHOLD INCOME
0.0/ 100
METRIC RATING
310th/ 347
METRIC RANK
$62,575
MEDIAN HOUSEHOLD INCOME
0.0/ 100
METRIC RATING
343rd/ 347
METRIC RANK
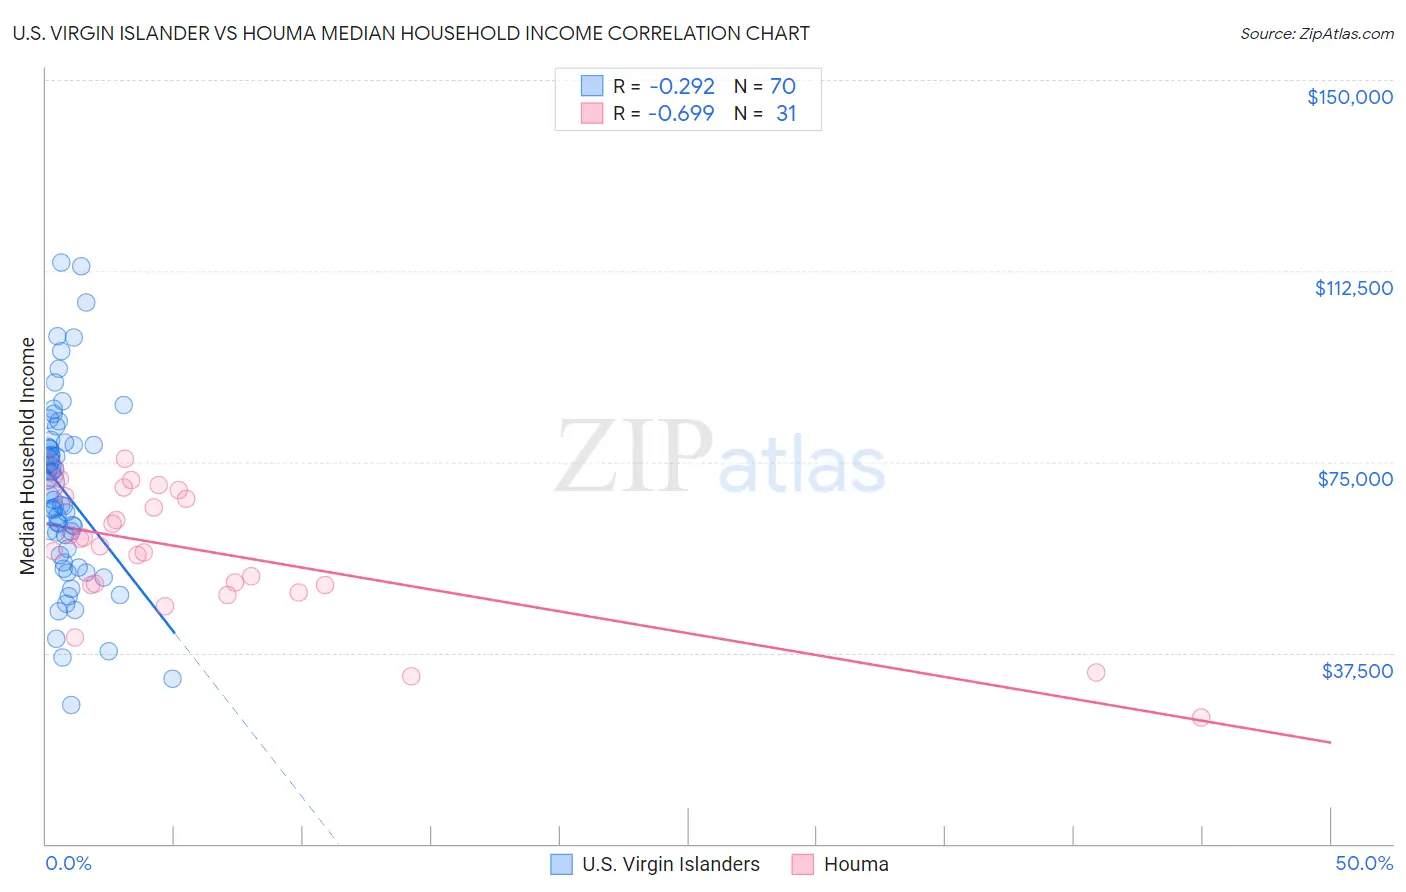
U.S. Virgin Islander vs Houma Median Household Income Correlation Chart
The statistical analysis conducted on geographies consisting of 87,500,449 people shows a weak negative correlation between the proportion of U.S. Virgin Islanders and median household income in the United States with a correlation coefficient (R) of -0.292 and weighted average of $71,853. Similarly, the statistical analysis conducted on geographies consisting of 36,792,126 people shows a significant negative correlation between the proportion of Houma and median household income in the United States with a correlation coefficient (R) of -0.699 and weighted average of $62,575, a difference of 14.8%.
Median Household Income Correlation Summary
| Measurement | U.S. Virgin Islander | Houma |
| Minimum | $27,212 | $24,706 |
| Maximum | $114,181 | $75,521 |
| Range | $86,969 | $50,815 |
| Mean | $69,001 | $57,222 |
| Median | $68,056 | $58,380 |
| Interquartile 25% (IQ1) | $56,650 | $50,766 |
| Interquartile 75% (IQ3) | $78,391 | $68,165 |
| Interquartile Range (IQR) | $21,741 | $17,398 |
| Standard Deviation (Sample) | $18,092 | $12,629 |
| Standard Deviation (Population) | $17,962 | $12,424 |
Similar Demographics by Median Household Income
Demographics Similar to U.S. Virgin Islanders by Median Household Income
In terms of median household income, the demographic groups most similar to U.S. Virgin Islanders are Immigrants from Caribbean ($71,860, a difference of 0.010%), Immigrants from Zaire ($71,801, a difference of 0.070%), Yakama ($72,225, a difference of 0.52%), Immigrants from Honduras ($71,452, a difference of 0.56%), and Immigrants from Bahamas ($71,349, a difference of 0.71%).
| Demographics | Rating | Rank | Median Household Income |
| Africans | 0.0 /100 | #303 | Tragic $72,650 |
| Immigrants | Haiti | 0.0 /100 | #304 | Tragic $72,599 |
| Hondurans | 0.0 /100 | #305 | Tragic $72,588 |
| Potawatomi | 0.0 /100 | #306 | Tragic $72,576 |
| Ute | 0.0 /100 | #307 | Tragic $72,402 |
| Yakama | 0.0 /100 | #308 | Tragic $72,225 |
| Immigrants | Caribbean | 0.0 /100 | #309 | Tragic $71,860 |
| U.S. Virgin Islanders | 0.0 /100 | #310 | Tragic $71,853 |
| Immigrants | Zaire | 0.0 /100 | #311 | Tragic $71,801 |
| Immigrants | Honduras | 0.0 /100 | #312 | Tragic $71,452 |
| Immigrants | Bahamas | 0.0 /100 | #313 | Tragic $71,349 |
| Dominicans | 0.0 /100 | #314 | Tragic $71,302 |
| Ottawa | 0.0 /100 | #315 | Tragic $70,984 |
| Apache | 0.0 /100 | #316 | Tragic $70,927 |
| Cajuns | 0.0 /100 | #317 | Tragic $70,605 |
Demographics Similar to Houma by Median Household Income
In terms of median household income, the demographic groups most similar to Houma are Pima ($63,262, a difference of 1.1%), Tohono O'odham ($61,663, a difference of 1.5%), Crow ($63,681, a difference of 1.8%), Pueblo ($64,692, a difference of 3.4%), and Hopi ($65,043, a difference of 3.9%).
| Demographics | Rating | Rank | Median Household Income |
| Creek | 0.0 /100 | #333 | Tragic $67,715 |
| Blacks/African Americans | 0.0 /100 | #334 | Tragic $67,573 |
| Cheyenne | 0.0 /100 | #335 | Tragic $66,974 |
| Immigrants | Congo | 0.0 /100 | #336 | Tragic $66,768 |
| Kiowa | 0.0 /100 | #337 | Tragic $65,914 |
| Immigrants | Yemen | 0.0 /100 | #338 | Tragic $65,194 |
| Hopi | 0.0 /100 | #339 | Tragic $65,043 |
| Pueblo | 0.0 /100 | #340 | Tragic $64,692 |
| Crow | 0.0 /100 | #341 | Tragic $63,681 |
| Pima | 0.0 /100 | #342 | Tragic $63,262 |
| Houma | 0.0 /100 | #343 | Tragic $62,575 |
| Tohono O'odham | 0.0 /100 | #344 | Tragic $61,663 |
| Puerto Ricans | 0.0 /100 | #345 | Tragic $59,197 |
| Navajo | 0.0 /100 | #346 | Tragic $59,159 |
| Lumbee | 0.0 /100 | #347 | Tragic $54,644 |