Immigrants from England vs Houma Median Household Income
COMPARE
Immigrants from England
Houma
Median Household Income
Median Household Income Comparison
Immigrants from England
Houma
$92,098
MEDIAN HOUSEHOLD INCOME
98.9/ 100
METRIC RATING
86th/ 347
METRIC RANK
$62,575
MEDIAN HOUSEHOLD INCOME
0.0/ 100
METRIC RATING
343rd/ 347
METRIC RANK
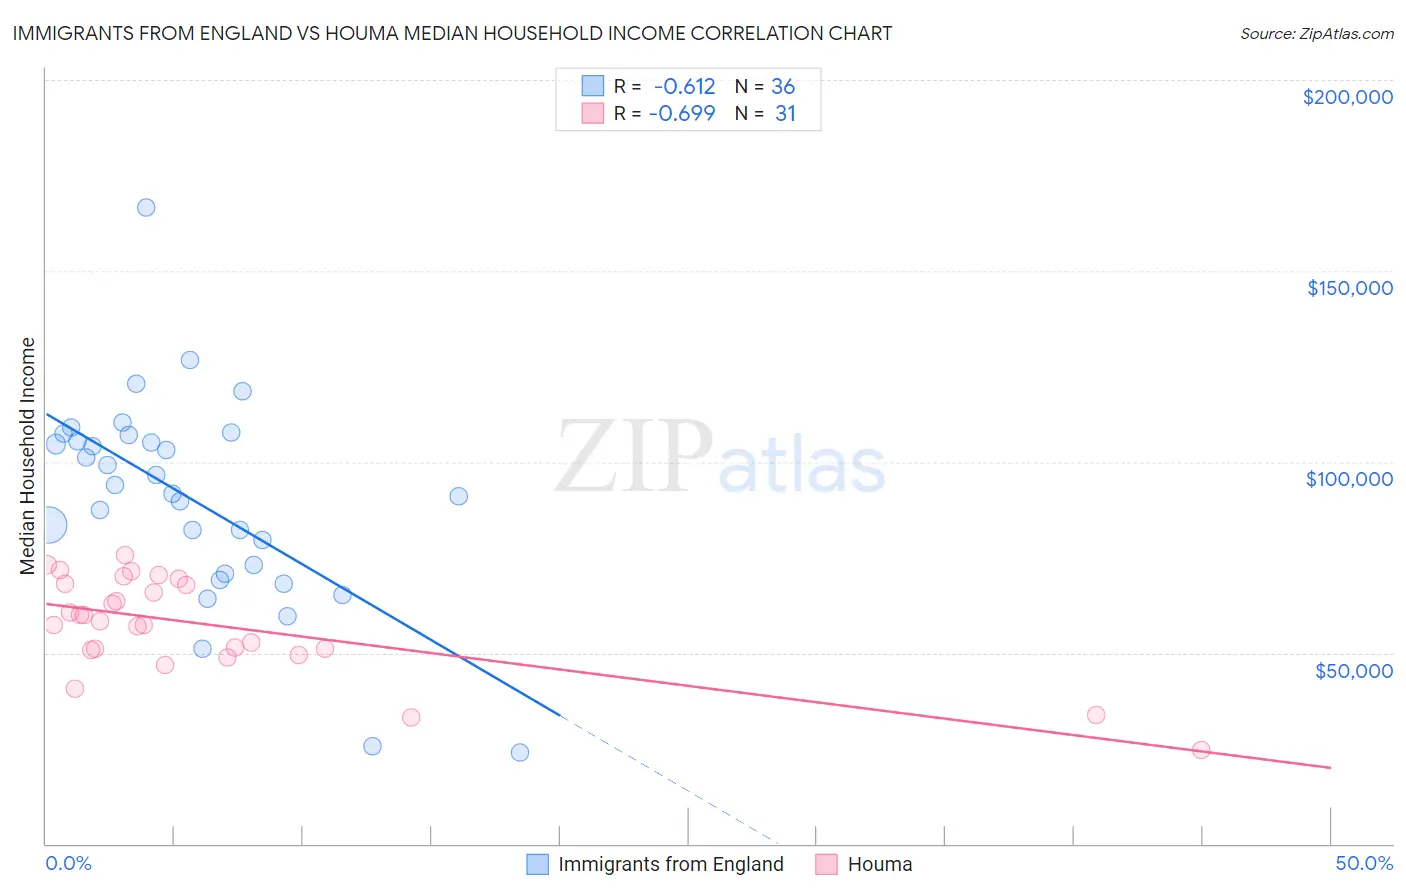
Immigrants from England vs Houma Median Household Income Correlation Chart
The statistical analysis conducted on geographies consisting of 391,695,361 people shows a significant negative correlation between the proportion of Immigrants from England and median household income in the United States with a correlation coefficient (R) of -0.612 and weighted average of $92,098. Similarly, the statistical analysis conducted on geographies consisting of 36,792,126 people shows a significant negative correlation between the proportion of Houma and median household income in the United States with a correlation coefficient (R) of -0.699 and weighted average of $62,575, a difference of 47.2%.
Median Household Income Correlation Summary
| Measurement | Immigrants from England | Houma |
| Minimum | $24,028 | $24,706 |
| Maximum | $166,753 | $75,521 |
| Range | $142,725 | $50,815 |
| Mean | $90,135 | $57,222 |
| Median | $92,873 | $58,380 |
| Interquartile 25% (IQ1) | $71,885 | $50,766 |
| Interquartile 75% (IQ3) | $106,085 | $68,165 |
| Interquartile Range (IQR) | $34,200 | $17,398 |
| Standard Deviation (Sample) | $27,284 | $12,629 |
| Standard Deviation (Population) | $26,903 | $12,424 |
Similar Demographics by Median Household Income
Demographics Similar to Immigrants from England by Median Household Income
In terms of median household income, the demographic groups most similar to Immigrants from England are Immigrants from Hungary ($92,094, a difference of 0.0%), Immigrants from Canada ($92,029, a difference of 0.080%), Romanian ($91,994, a difference of 0.11%), Assyrian/Chaldean/Syriac ($91,991, a difference of 0.12%), and Immigrants from Vietnam ($91,987, a difference of 0.12%).
| Demographics | Rating | Rank | Median Household Income |
| Sri Lankans | 99.4 /100 | #79 | Exceptional $93,093 |
| Tongans | 99.4 /100 | #80 | Exceptional $93,076 |
| Immigrants | Eastern Europe | 99.4 /100 | #81 | Exceptional $93,051 |
| Immigrants | Spain | 99.3 /100 | #82 | Exceptional $92,732 |
| Italians | 99.1 /100 | #83 | Exceptional $92,475 |
| Immigrants | Argentina | 99.1 /100 | #84 | Exceptional $92,417 |
| Immigrants | Croatia | 99.0 /100 | #85 | Exceptional $92,225 |
| Immigrants | England | 98.9 /100 | #86 | Exceptional $92,098 |
| Immigrants | Hungary | 98.9 /100 | #87 | Exceptional $92,094 |
| Immigrants | Canada | 98.8 /100 | #88 | Exceptional $92,029 |
| Romanians | 98.8 /100 | #89 | Exceptional $91,994 |
| Assyrians/Chaldeans/Syriacs | 98.8 /100 | #90 | Exceptional $91,991 |
| Immigrants | Vietnam | 98.8 /100 | #91 | Exceptional $91,987 |
| Immigrants | Western Europe | 98.8 /100 | #92 | Exceptional $91,936 |
| Immigrants | Lebanon | 98.7 /100 | #93 | Exceptional $91,887 |
Demographics Similar to Houma by Median Household Income
In terms of median household income, the demographic groups most similar to Houma are Pima ($63,262, a difference of 1.1%), Tohono O'odham ($61,663, a difference of 1.5%), Crow ($63,681, a difference of 1.8%), Pueblo ($64,692, a difference of 3.4%), and Hopi ($65,043, a difference of 3.9%).
| Demographics | Rating | Rank | Median Household Income |
| Creek | 0.0 /100 | #333 | Tragic $67,715 |
| Blacks/African Americans | 0.0 /100 | #334 | Tragic $67,573 |
| Cheyenne | 0.0 /100 | #335 | Tragic $66,974 |
| Immigrants | Congo | 0.0 /100 | #336 | Tragic $66,768 |
| Kiowa | 0.0 /100 | #337 | Tragic $65,914 |
| Immigrants | Yemen | 0.0 /100 | #338 | Tragic $65,194 |
| Hopi | 0.0 /100 | #339 | Tragic $65,043 |
| Pueblo | 0.0 /100 | #340 | Tragic $64,692 |
| Crow | 0.0 /100 | #341 | Tragic $63,681 |
| Pima | 0.0 /100 | #342 | Tragic $63,262 |
| Houma | 0.0 /100 | #343 | Tragic $62,575 |
| Tohono O'odham | 0.0 /100 | #344 | Tragic $61,663 |
| Puerto Ricans | 0.0 /100 | #345 | Tragic $59,197 |
| Navajo | 0.0 /100 | #346 | Tragic $59,159 |
| Lumbee | 0.0 /100 | #347 | Tragic $54,644 |