Trinidadian and Tobagonian vs Houma Unemployment Among Ages 25 to 29 years
COMPARE
Trinidadian and Tobagonian
Houma
Unemployment Among Ages 25 to 29 years
Unemployment Among Ages 25 to 29 years Comparison
Trinidadians and Tobagonians
Houma
7.8%
UNEMPLOYMENT AMONG AGES 25 TO 29 YEARS
0.0/ 100
METRIC RATING
294th/ 347
METRIC RANK
8.7%
UNEMPLOYMENT AMONG AGES 25 TO 29 YEARS
0.0/ 100
METRIC RATING
324th/ 347
METRIC RANK
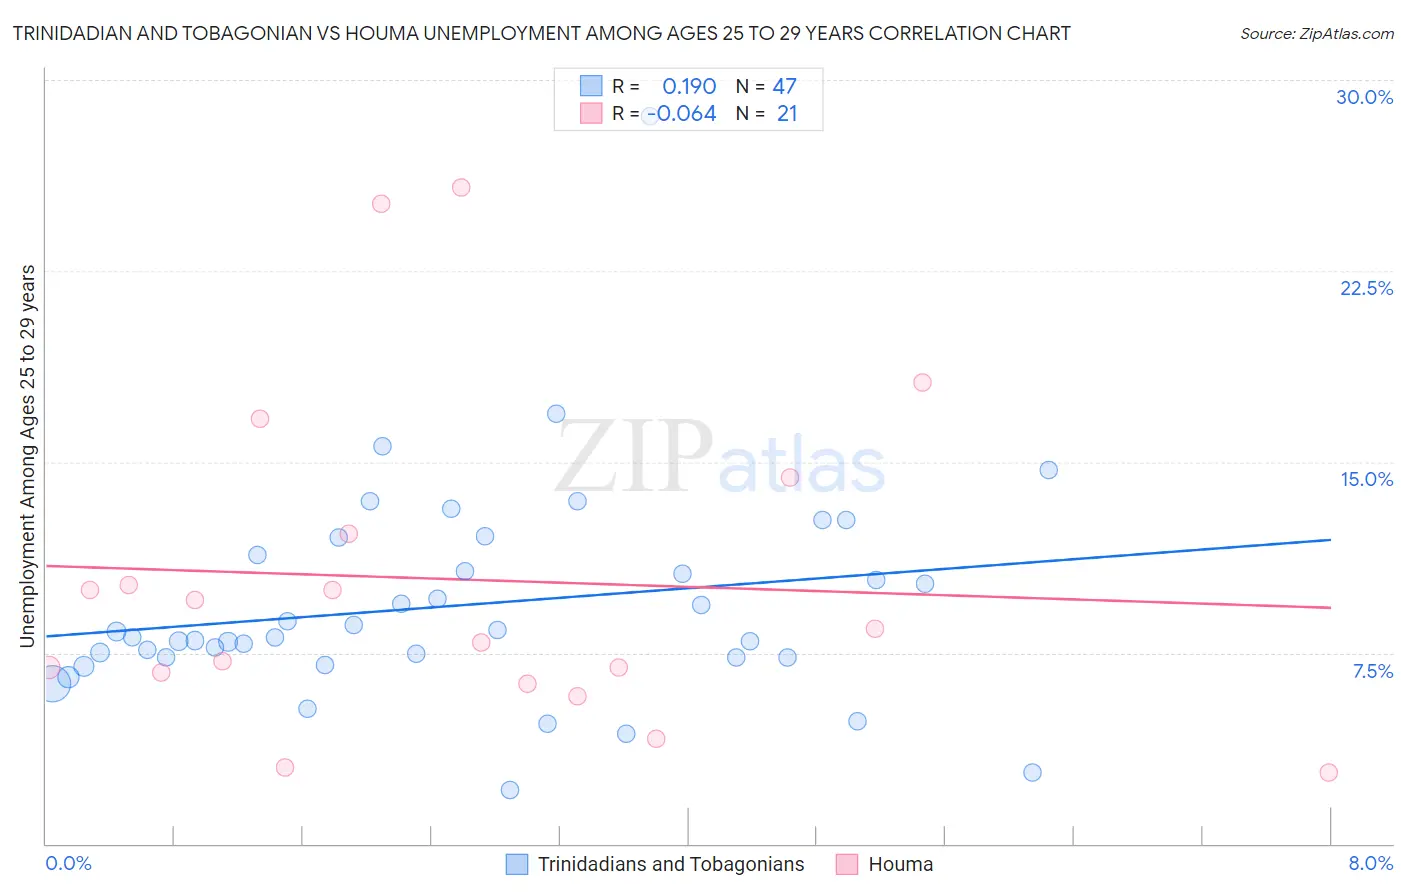
Trinidadian and Tobagonian vs Houma Unemployment Among Ages 25 to 29 years Correlation Chart
The statistical analysis conducted on geographies consisting of 214,424,084 people shows a poor positive correlation between the proportion of Trinidadians and Tobagonians and unemployment rate among population between the ages 25 and 29 in the United States with a correlation coefficient (R) of 0.190 and weighted average of 7.8%. Similarly, the statistical analysis conducted on geographies consisting of 36,263,529 people shows a slight negative correlation between the proportion of Houma and unemployment rate among population between the ages 25 and 29 in the United States with a correlation coefficient (R) of -0.064 and weighted average of 8.7%, a difference of 12.0%.
Unemployment Among Ages 25 to 29 years Correlation Summary
| Measurement | Trinidadian and Tobagonian | Houma |
| Minimum | 2.1% | 2.8% |
| Maximum | 28.6% | 25.8% |
| Range | 26.5% | 23.0% |
| Mean | 9.4% | 10.4% |
| Median | 8.1% | 8.5% |
| Interquartile 25% (IQ1) | 7.3% | 6.5% |
| Interquartile 75% (IQ3) | 11.3% | 13.3% |
| Interquartile Range (IQR) | 4.0% | 6.8% |
| Standard Deviation (Sample) | 4.3% | 6.4% |
| Standard Deviation (Population) | 4.2% | 6.3% |
Similar Demographics by Unemployment Among Ages 25 to 29 years
Demographics Similar to Trinidadians and Tobagonians by Unemployment Among Ages 25 to 29 years
In terms of unemployment among ages 25 to 29 years, the demographic groups most similar to Trinidadians and Tobagonians are Immigrants from Belize (7.8%, a difference of 0.28%), Chippewa (7.8%, a difference of 0.33%), Comanche (7.8%, a difference of 0.46%), Immigrants from West Indies (7.8%, a difference of 0.59%), and Hispanic or Latino (7.7%, a difference of 0.74%).
| Demographics | Rating | Rank | Unemployment Among Ages 25 to 29 years |
| Immigrants | Mexico | 0.0 /100 | #287 | Tragic 7.6% |
| Africans | 0.0 /100 | #288 | Tragic 7.6% |
| Belizeans | 0.0 /100 | #289 | Tragic 7.7% |
| Armenians | 0.0 /100 | #290 | Tragic 7.7% |
| Hispanics or Latinos | 0.0 /100 | #291 | Tragic 7.7% |
| Chippewa | 0.0 /100 | #292 | Tragic 7.8% |
| Immigrants | Belize | 0.0 /100 | #293 | Tragic 7.8% |
| Trinidadians and Tobagonians | 0.0 /100 | #294 | Tragic 7.8% |
| Comanche | 0.0 /100 | #295 | Tragic 7.8% |
| Immigrants | West Indies | 0.0 /100 | #296 | Tragic 7.8% |
| Blackfeet | 0.0 /100 | #297 | Tragic 7.9% |
| Immigrants | Trinidad and Tobago | 0.0 /100 | #298 | Tragic 7.9% |
| Barbadians | 0.0 /100 | #299 | Tragic 7.9% |
| Central American Indians | 0.0 /100 | #300 | Tragic 7.9% |
| West Indians | 0.0 /100 | #301 | Tragic 7.9% |
Demographics Similar to Houma by Unemployment Among Ages 25 to 29 years
In terms of unemployment among ages 25 to 29 years, the demographic groups most similar to Houma are Dominican (8.7%, a difference of 0.36%), Tlingit-Haida (8.7%, a difference of 0.45%), Yakama (8.8%, a difference of 0.51%), Immigrants from Dominican Republic (8.6%, a difference of 1.2%), and Black/African American (8.6%, a difference of 1.9%).
| Demographics | Rating | Rank | Unemployment Among Ages 25 to 29 years |
| Immigrants | Guyana | 0.0 /100 | #317 | Tragic 8.5% |
| Guyanese | 0.0 /100 | #318 | Tragic 8.5% |
| Immigrants | Armenia | 0.0 /100 | #319 | Tragic 8.5% |
| Blacks/African Americans | 0.0 /100 | #320 | Tragic 8.6% |
| Immigrants | Dominican Republic | 0.0 /100 | #321 | Tragic 8.6% |
| Tlingit-Haida | 0.0 /100 | #322 | Tragic 8.7% |
| Dominicans | 0.0 /100 | #323 | Tragic 8.7% |
| Houma | 0.0 /100 | #324 | Tragic 8.7% |
| Yakama | 0.0 /100 | #325 | Tragic 8.8% |
| Shoshone | 0.0 /100 | #326 | Tragic 9.2% |
| Colville | 0.0 /100 | #327 | Tragic 9.2% |
| Apache | 0.0 /100 | #328 | Tragic 9.5% |
| Aleuts | 0.0 /100 | #329 | Tragic 9.7% |
| Natives/Alaskans | 0.0 /100 | #330 | Tragic 9.8% |
| Alaska Natives | 0.0 /100 | #331 | Tragic 10.2% |