Thai vs Inupiat Median Male Earnings
COMPARE
Thai
Inupiat
Median Male Earnings
Median Male Earnings Comparison
Thais
Inupiat
$72,135
MEDIAN MALE EARNINGS
100.0/ 100
METRIC RATING
4th/ 347
METRIC RANK
$47,281
MEDIAN MALE EARNINGS
0.1/ 100
METRIC RATING
296th/ 347
METRIC RANK
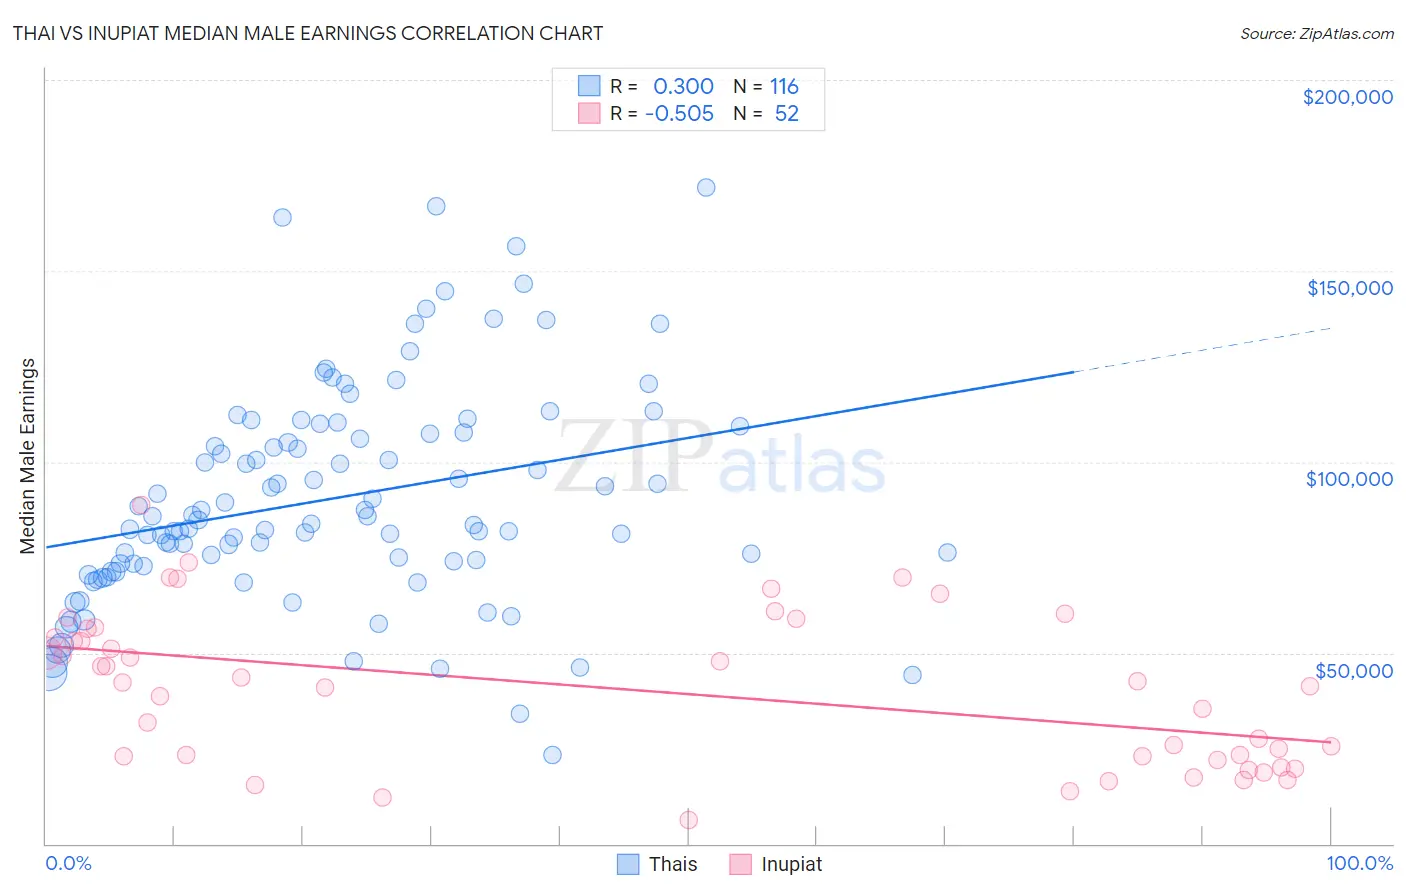
Thai vs Inupiat Median Male Earnings Correlation Chart
The statistical analysis conducted on geographies consisting of 475,691,954 people shows a weak positive correlation between the proportion of Thais and median male earnings in the United States with a correlation coefficient (R) of 0.300 and weighted average of $72,135. Similarly, the statistical analysis conducted on geographies consisting of 96,323,006 people shows a substantial negative correlation between the proportion of Inupiat and median male earnings in the United States with a correlation coefficient (R) of -0.505 and weighted average of $47,281, a difference of 52.6%.
Median Male Earnings Correlation Summary
| Measurement | Thai | Inupiat |
| Minimum | $23,362 | $6,250 |
| Maximum | $171,875 | $88,594 |
| Range | $148,513 | $82,344 |
| Mean | $90,264 | $40,024 |
| Median | $84,301 | $41,688 |
| Interquartile 25% (IQ1) | $73,018 | $22,499 |
| Interquartile 75% (IQ3) | $107,587 | $55,179 |
| Interquartile Range (IQR) | $34,569 | $32,680 |
| Standard Deviation (Sample) | $28,453 | $19,878 |
| Standard Deviation (Population) | $28,330 | $19,686 |
Similar Demographics by Median Male Earnings
Demographics Similar to Thais by Median Male Earnings
In terms of median male earnings, the demographic groups most similar to Thais are Immigrants from Singapore ($71,348, a difference of 1.1%), Iranian ($70,648, a difference of 2.1%), Immigrants from Taiwan ($74,031, a difference of 2.6%), Immigrants from Hong Kong ($70,146, a difference of 2.8%), and Immigrants from India ($74,207, a difference of 2.9%).
| Demographics | Rating | Rank | Median Male Earnings |
| Filipinos | 100.0 /100 | #1 | Exceptional $74,224 |
| Immigrants | India | 100.0 /100 | #2 | Exceptional $74,207 |
| Immigrants | Taiwan | 100.0 /100 | #3 | Exceptional $74,031 |
| Thais | 100.0 /100 | #4 | Exceptional $72,135 |
| Immigrants | Singapore | 100.0 /100 | #5 | Exceptional $71,348 |
| Iranians | 100.0 /100 | #6 | Exceptional $70,648 |
| Immigrants | Hong Kong | 100.0 /100 | #7 | Exceptional $70,146 |
| Immigrants | Iran | 100.0 /100 | #8 | Exceptional $69,284 |
| Immigrants | South Central Asia | 100.0 /100 | #9 | Exceptional $68,960 |
| Immigrants | Israel | 100.0 /100 | #10 | Exceptional $68,716 |
| Immigrants | Ireland | 100.0 /100 | #11 | Exceptional $67,698 |
| Immigrants | Australia | 100.0 /100 | #12 | Exceptional $67,634 |
| Immigrants | China | 100.0 /100 | #13 | Exceptional $67,353 |
| Okinawans | 100.0 /100 | #14 | Exceptional $67,232 |
| Immigrants | Eastern Asia | 100.0 /100 | #15 | Exceptional $66,903 |
Demographics Similar to Inupiat by Median Male Earnings
In terms of median male earnings, the demographic groups most similar to Inupiat are Dominican ($47,204, a difference of 0.16%), Immigrants from Micronesia ($47,177, a difference of 0.22%), Central American Indian ($47,433, a difference of 0.32%), Immigrants from Nicaragua ($47,482, a difference of 0.43%), and Immigrants from Zaire ($47,070, a difference of 0.45%).
| Demographics | Rating | Rank | Median Male Earnings |
| Chickasaw | 0.1 /100 | #289 | Tragic $47,832 |
| Immigrants | Belize | 0.1 /100 | #290 | Tragic $47,809 |
| Choctaw | 0.1 /100 | #291 | Tragic $47,729 |
| Immigrants | Dominica | 0.1 /100 | #292 | Tragic $47,651 |
| Indonesians | 0.1 /100 | #293 | Tragic $47,503 |
| Immigrants | Nicaragua | 0.1 /100 | #294 | Tragic $47,482 |
| Central American Indians | 0.1 /100 | #295 | Tragic $47,433 |
| Inupiat | 0.1 /100 | #296 | Tragic $47,281 |
| Dominicans | 0.1 /100 | #297 | Tragic $47,204 |
| Immigrants | Micronesia | 0.1 /100 | #298 | Tragic $47,177 |
| Immigrants | Zaire | 0.1 /100 | #299 | Tragic $47,070 |
| U.S. Virgin Islanders | 0.1 /100 | #300 | Tragic $47,066 |
| Immigrants | Latin America | 0.1 /100 | #301 | Tragic $46,941 |
| Seminole | 0.1 /100 | #302 | Tragic $46,783 |
| Yaqui | 0.1 /100 | #303 | Tragic $46,777 |