Spanish vs Slovak Householder Income Ages 45 - 64 years
COMPARE
Spanish
Slovak
Householder Income Ages 45 - 64 years
Householder Income Ages 45 - 64 years Comparison
Spanish
Slovaks
$98,554
HOUSEHOLDER INCOME AGES 45 - 64 YEARS
29.2/ 100
METRIC RATING
195th/ 347
METRIC RANK
$101,029
HOUSEHOLDER INCOME AGES 45 - 64 YEARS
58.8/ 100
METRIC RATING
170th/ 347
METRIC RANK
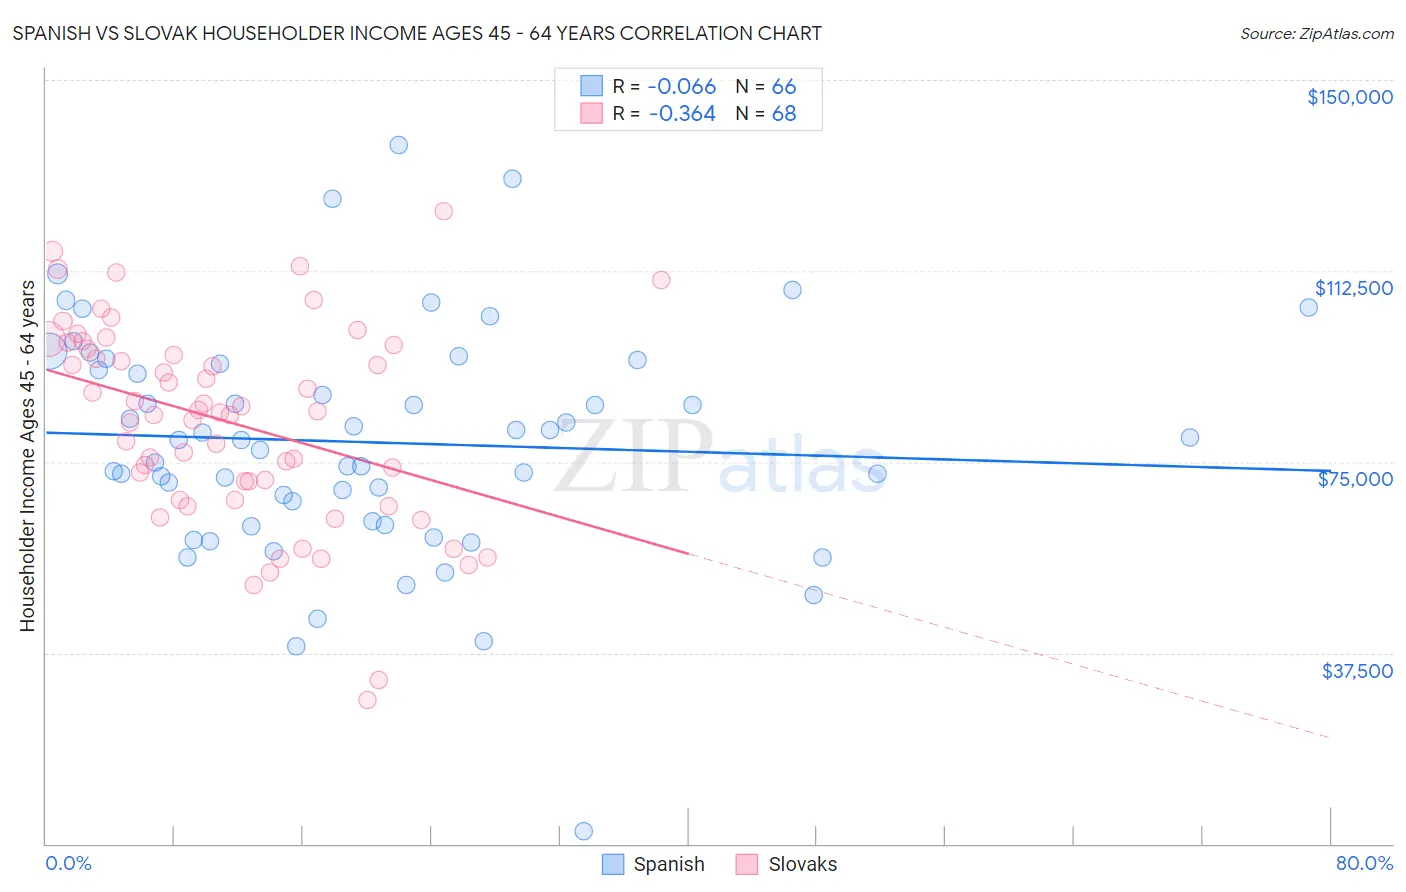
Spanish vs Slovak Householder Income Ages 45 - 64 years Correlation Chart
The statistical analysis conducted on geographies consisting of 421,243,274 people shows a slight negative correlation between the proportion of Spanish and household income with householder between the ages 45 and 64 in the United States with a correlation coefficient (R) of -0.066 and weighted average of $98,554. Similarly, the statistical analysis conducted on geographies consisting of 397,139,632 people shows a mild negative correlation between the proportion of Slovaks and household income with householder between the ages 45 and 64 in the United States with a correlation coefficient (R) of -0.364 and weighted average of $101,029, a difference of 2.5%.
Householder Income Ages 45 - 64 years Correlation Summary
| Measurement | Spanish | Slovak |
| Minimum | $2,499 | $28,125 |
| Maximum | $137,143 | $124,318 |
| Range | $134,644 | $96,193 |
| Mean | $78,857 | $82,752 |
| Median | $79,247 | $84,870 |
| Interquartile 25% (IQ1) | $63,421 | $69,341 |
| Interquartile 75% (IQ3) | $94,394 | $97,616 |
| Interquartile Range (IQR) | $30,972 | $28,275 |
| Standard Deviation (Sample) | $22,794 | $19,751 |
| Standard Deviation (Population) | $22,620 | $19,605 |
Similar Demographics by Householder Income Ages 45 - 64 years
Demographics Similar to Spanish by Householder Income Ages 45 - 64 years
In terms of householder income ages 45 - 64 years, the demographic groups most similar to Spanish are Immigrants from Eastern Africa ($98,467, a difference of 0.090%), Uruguayan ($98,660, a difference of 0.11%), Puget Sound Salish ($98,340, a difference of 0.22%), Hawaiian ($98,778, a difference of 0.23%), and Celtic ($98,896, a difference of 0.35%).
| Demographics | Rating | Rank | Householder Income Ages 45 - 64 years |
| Immigrants | Portugal | 36.3 /100 | #188 | Fair $99,203 |
| Immigrants | South America | 35.4 /100 | #189 | Fair $99,126 |
| French Canadians | 35.1 /100 | #190 | Fair $99,093 |
| Kenyans | 33.7 /100 | #191 | Fair $98,970 |
| Celtics | 32.9 /100 | #192 | Fair $98,896 |
| Hawaiians | 31.6 /100 | #193 | Fair $98,778 |
| Uruguayans | 30.3 /100 | #194 | Fair $98,660 |
| Spanish | 29.2 /100 | #195 | Fair $98,554 |
| Immigrants | Eastern Africa | 28.3 /100 | #196 | Fair $98,467 |
| Puget Sound Salish | 27.0 /100 | #197 | Fair $98,340 |
| Immigrants | Iraq | 25.7 /100 | #198 | Fair $98,201 |
| Whites/Caucasians | 24.6 /100 | #199 | Fair $98,091 |
| Immigrants | Kenya | 23.5 /100 | #200 | Fair $97,964 |
| Yugoslavians | 20.0 /100 | #201 | Fair $97,558 |
| Tlingit-Haida | 18.9 /100 | #202 | Poor $97,417 |
Demographics Similar to Slovaks by Householder Income Ages 45 - 64 years
In terms of householder income ages 45 - 64 years, the demographic groups most similar to Slovaks are South American Indian ($101,171, a difference of 0.14%), Guamanian/Chamorro ($101,170, a difference of 0.14%), South American ($100,837, a difference of 0.19%), Czechoslovakian ($101,387, a difference of 0.35%), and Immigrants from Uzbekistan ($100,523, a difference of 0.50%).
| Demographics | Rating | Rank | Householder Income Ages 45 - 64 years |
| English | 70.1 /100 | #163 | Good $102,021 |
| Immigrants | Morocco | 70.0 /100 | #164 | Good $102,015 |
| Immigrants | Albania | 69.4 /100 | #165 | Good $101,957 |
| Samoans | 65.3 /100 | #166 | Good $101,580 |
| Czechoslovakians | 63.0 /100 | #167 | Good $101,387 |
| South American Indians | 60.5 /100 | #168 | Good $101,171 |
| Guamanians/Chamorros | 60.5 /100 | #169 | Good $101,170 |
| Slovaks | 58.8 /100 | #170 | Average $101,029 |
| South Americans | 56.4 /100 | #171 | Average $100,837 |
| Immigrants | Uzbekistan | 52.5 /100 | #172 | Average $100,523 |
| Alsatians | 51.4 /100 | #173 | Average $100,435 |
| Welsh | 50.0 /100 | #174 | Average $100,322 |
| Germans | 48.8 /100 | #175 | Average $100,224 |
| Immigrants | Costa Rica | 47.7 /100 | #176 | Average $100,141 |
| Moroccans | 47.7 /100 | #177 | Average $100,138 |