Taiwanese vs Immigrants from Uzbekistan Median Female Earnings
COMPARE
Taiwanese
Immigrants from Uzbekistan
Median Female Earnings
Median Female Earnings Comparison
Taiwanese
Immigrants from Uzbekistan
$40,576
MEDIAN FEMALE EARNINGS
86.1/ 100
METRIC RATING
138th/ 347
METRIC RANK
$43,363
MEDIAN FEMALE EARNINGS
100.0/ 100
METRIC RATING
50th/ 347
METRIC RANK
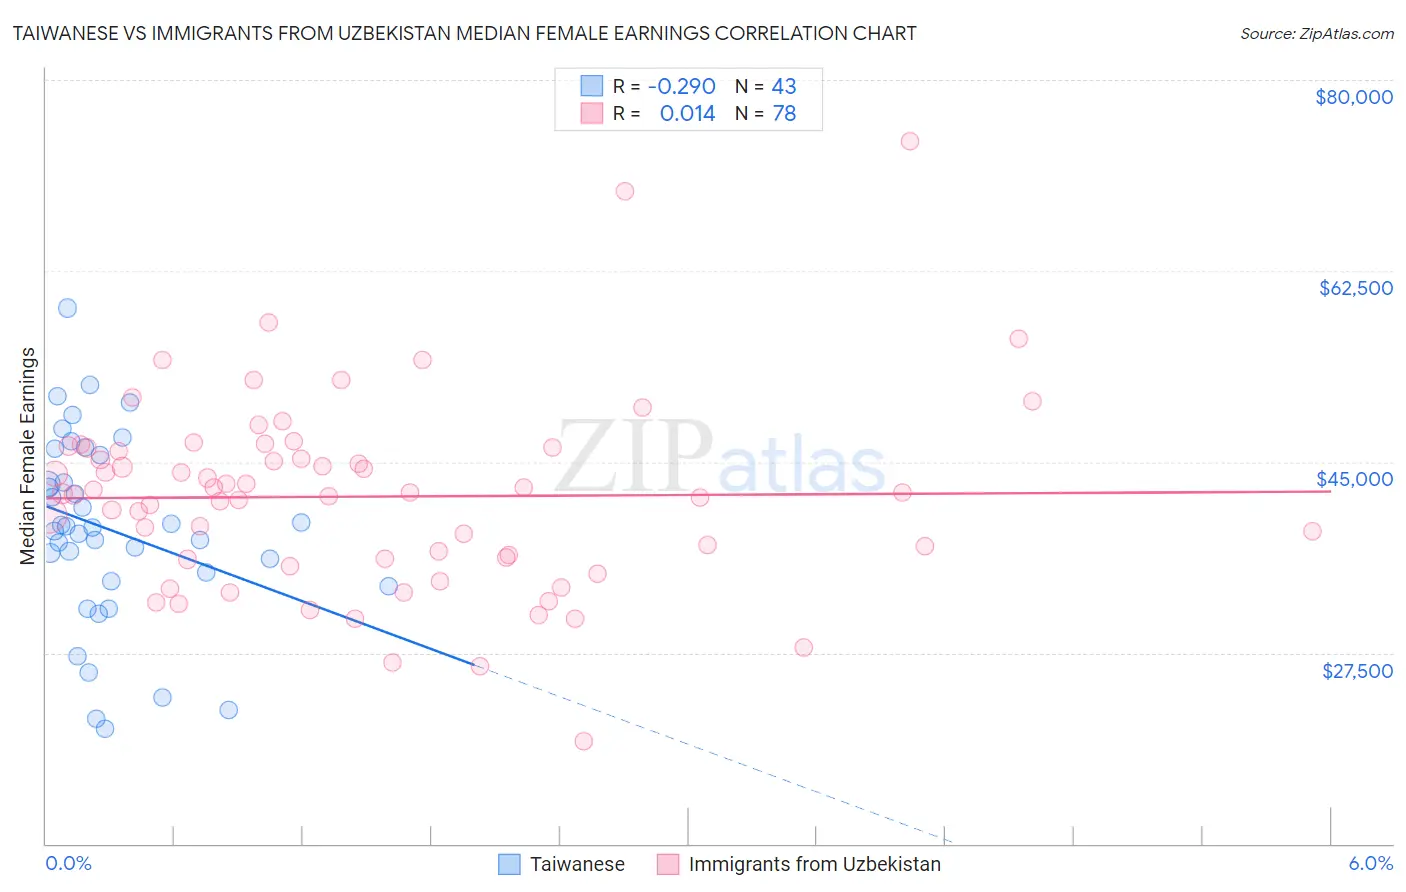
Taiwanese vs Immigrants from Uzbekistan Median Female Earnings Correlation Chart
The statistical analysis conducted on geographies consisting of 31,721,885 people shows a weak negative correlation between the proportion of Taiwanese and median female earnings in the United States with a correlation coefficient (R) of -0.290 and weighted average of $40,576. Similarly, the statistical analysis conducted on geographies consisting of 118,750,050 people shows no correlation between the proportion of Immigrants from Uzbekistan and median female earnings in the United States with a correlation coefficient (R) of 0.014 and weighted average of $43,363, a difference of 6.9%.
Median Female Earnings Correlation Summary
| Measurement | Taiwanese | Immigrants from Uzbekistan |
| Minimum | $20,555 | $19,444 |
| Maximum | $59,093 | $74,375 |
| Range | $38,538 | $54,931 |
| Mean | $38,751 | $41,817 |
| Median | $39,019 | $42,141 |
| Interquartile 25% (IQ1) | $34,095 | $36,088 |
| Interquartile 75% (IQ3) | $45,655 | $46,297 |
| Interquartile Range (IQR) | $11,560 | $10,209 |
| Standard Deviation (Sample) | $8,643 | $8,848 |
| Standard Deviation (Population) | $8,542 | $8,791 |
Similar Demographics by Median Female Earnings
Demographics Similar to Taiwanese by Median Female Earnings
In terms of median female earnings, the demographic groups most similar to Taiwanese are Immigrants from South Eastern Asia ($40,558, a difference of 0.040%), Pakistani ($40,596, a difference of 0.050%), Serbian ($40,539, a difference of 0.090%), Immigrants from Eastern Africa ($40,644, a difference of 0.17%), and Immigrants from Syria ($40,499, a difference of 0.19%).
| Demographics | Rating | Rank | Median Female Earnings |
| Chileans | 90.0 /100 | #131 | Exceptional $40,757 |
| Immigrants | Uganda | 89.7 /100 | #132 | Excellent $40,739 |
| Syrians | 89.5 /100 | #133 | Excellent $40,727 |
| Arabs | 89.3 /100 | #134 | Excellent $40,718 |
| Immigrants | Nepal | 89.0 /100 | #135 | Excellent $40,704 |
| Immigrants | Eastern Africa | 87.7 /100 | #136 | Excellent $40,644 |
| Pakistanis | 86.6 /100 | #137 | Excellent $40,596 |
| Taiwanese | 86.1 /100 | #138 | Excellent $40,576 |
| Immigrants | South Eastern Asia | 85.7 /100 | #139 | Excellent $40,558 |
| Serbians | 85.2 /100 | #140 | Excellent $40,539 |
| Immigrants | Syria | 84.1 /100 | #141 | Excellent $40,499 |
| Sri Lankans | 84.0 /100 | #142 | Excellent $40,496 |
| Northern Europeans | 83.9 /100 | #143 | Excellent $40,491 |
| Immigrants | North Macedonia | 83.8 /100 | #144 | Excellent $40,488 |
| Brazilians | 83.6 /100 | #145 | Excellent $40,483 |
Demographics Similar to Immigrants from Uzbekistan by Median Female Earnings
In terms of median female earnings, the demographic groups most similar to Immigrants from Uzbekistan are Maltese ($43,357, a difference of 0.010%), Immigrants from Serbia ($43,385, a difference of 0.050%), Immigrants from Indonesia ($43,412, a difference of 0.11%), Immigrants from Lithuania ($43,317, a difference of 0.11%), and Immigrants from Eastern Europe ($43,309, a difference of 0.12%).
| Demographics | Rating | Rank | Median Female Earnings |
| Bulgarians | 100.0 /100 | #43 | Exceptional $43,638 |
| Immigrants | Czechoslovakia | 100.0 /100 | #44 | Exceptional $43,571 |
| Immigrants | Europe | 100.0 /100 | #45 | Exceptional $43,523 |
| Immigrants | Bolivia | 100.0 /100 | #46 | Exceptional $43,467 |
| Bolivians | 100.0 /100 | #47 | Exceptional $43,445 |
| Immigrants | Indonesia | 100.0 /100 | #48 | Exceptional $43,412 |
| Immigrants | Serbia | 100.0 /100 | #49 | Exceptional $43,385 |
| Immigrants | Uzbekistan | 100.0 /100 | #50 | Exceptional $43,363 |
| Maltese | 100.0 /100 | #51 | Exceptional $43,357 |
| Immigrants | Lithuania | 99.9 /100 | #52 | Exceptional $43,317 |
| Immigrants | Eastern Europe | 99.9 /100 | #53 | Exceptional $43,309 |
| Australians | 99.9 /100 | #54 | Exceptional $43,308 |
| Egyptians | 99.9 /100 | #55 | Exceptional $43,305 |
| Immigrants | Croatia | 99.9 /100 | #56 | Exceptional $43,258 |
| Ethiopians | 99.9 /100 | #57 | Exceptional $43,243 |