Immigrants from Hungary vs Immigrants from Argentina Median Earnings
COMPARE
Immigrants from Hungary
Immigrants from Argentina
Median Earnings
Median Earnings Comparison
Immigrants from Hungary
Immigrants from Argentina
$50,227
MEDIAN EARNINGS
99.5/ 100
METRIC RATING
84th/ 347
METRIC RANK
$49,841
MEDIAN EARNINGS
99.2/ 100
METRIC RATING
92nd/ 347
METRIC RANK
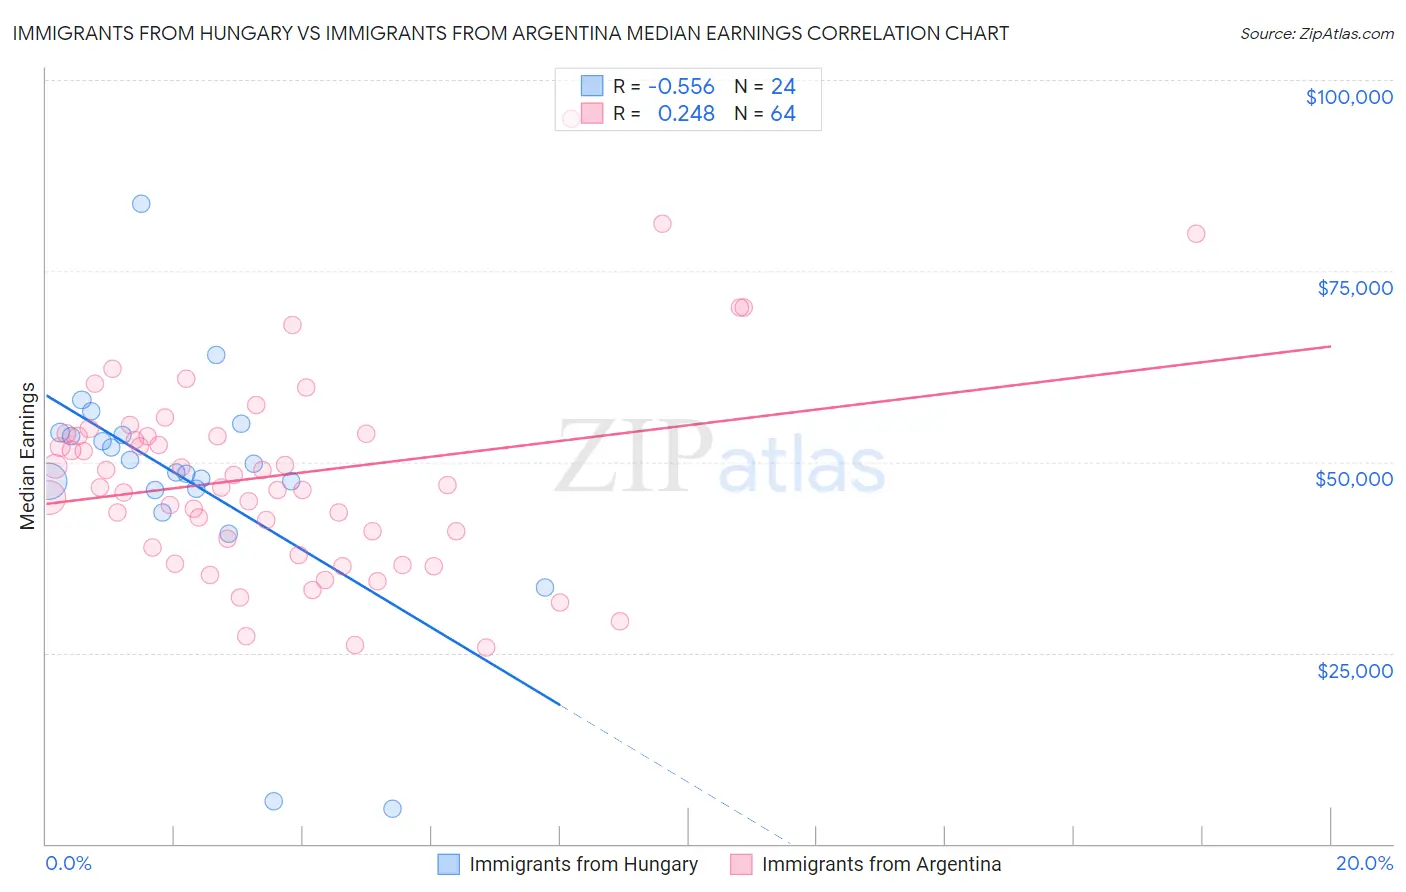
Immigrants from Hungary vs Immigrants from Argentina Median Earnings Correlation Chart
The statistical analysis conducted on geographies consisting of 195,705,454 people shows a substantial negative correlation between the proportion of Immigrants from Hungary and median earnings in the United States with a correlation coefficient (R) of -0.556 and weighted average of $50,227. Similarly, the statistical analysis conducted on geographies consisting of 264,409,503 people shows a weak positive correlation between the proportion of Immigrants from Argentina and median earnings in the United States with a correlation coefficient (R) of 0.248 and weighted average of $49,841, a difference of 0.77%.
Median Earnings Correlation Summary
| Measurement | Immigrants from Hungary | Immigrants from Argentina |
| Minimum | $4,622 | $25,634 |
| Maximum | $83,751 | $94,961 |
| Range | $79,129 | $69,327 |
| Mean | $47,628 | $48,229 |
| Median | $49,169 | $46,837 |
| Interquartile 25% (IQ1) | $46,381 | $39,341 |
| Interquartile 75% (IQ3) | $53,646 | $53,567 |
| Interquartile Range (IQR) | $7,266 | $14,226 |
| Standard Deviation (Sample) | $15,967 | $13,180 |
| Standard Deviation (Population) | $15,631 | $13,077 |
Demographics Similar to Immigrants from Hungary and Immigrants from Argentina by Median Earnings
In terms of median earnings, the demographic groups most similar to Immigrants from Hungary are Immigrants from Kazakhstan ($50,225, a difference of 0.0%), Romanian ($50,244, a difference of 0.030%), Immigrants from Canada ($50,192, a difference of 0.070%), Immigrants from Moldova ($50,274, a difference of 0.090%), and Immigrants from Southern Europe ($50,280, a difference of 0.11%). Similarly, the demographic groups most similar to Immigrants from Argentina are Armenian ($49,804, a difference of 0.070%), Macedonian ($49,893, a difference of 0.11%), Italian ($49,915, a difference of 0.15%), Croatian ($49,724, a difference of 0.23%), and Immigrants from England ($49,722, a difference of 0.24%).
| Demographics | Rating | Rank | Median Earnings |
| Argentineans | 99.6 /100 | #78 | Exceptional $50,399 |
| Laotians | 99.6 /100 | #79 | Exceptional $50,343 |
| Ukrainians | 99.6 /100 | #80 | Exceptional $50,320 |
| Immigrants | Southern Europe | 99.6 /100 | #81 | Exceptional $50,280 |
| Immigrants | Moldova | 99.5 /100 | #82 | Exceptional $50,274 |
| Romanians | 99.5 /100 | #83 | Exceptional $50,244 |
| Immigrants | Hungary | 99.5 /100 | #84 | Exceptional $50,227 |
| Immigrants | Kazakhstan | 99.5 /100 | #85 | Exceptional $50,225 |
| Immigrants | Canada | 99.5 /100 | #86 | Exceptional $50,192 |
| Immigrants | Uzbekistan | 99.5 /100 | #87 | Exceptional $50,151 |
| Albanians | 99.4 /100 | #88 | Exceptional $50,116 |
| Immigrants | North America | 99.4 /100 | #89 | Exceptional $50,108 |
| Italians | 99.3 /100 | #90 | Exceptional $49,915 |
| Macedonians | 99.2 /100 | #91 | Exceptional $49,893 |
| Immigrants | Argentina | 99.2 /100 | #92 | Exceptional $49,841 |
| Armenians | 99.1 /100 | #93 | Exceptional $49,804 |
| Croatians | 99.0 /100 | #94 | Exceptional $49,724 |
| Immigrants | England | 99.0 /100 | #95 | Exceptional $49,722 |
| Immigrants | Lebanon | 99.0 /100 | #96 | Exceptional $49,682 |
| Immigrants | North Macedonia | 98.9 /100 | #97 | Exceptional $49,658 |
| Immigrants | Northern Africa | 98.9 /100 | #98 | Exceptional $49,648 |