Taiwanese vs Russian Median Family Income
COMPARE
Taiwanese
Russian
Median Family Income
Median Family Income Comparison
Taiwanese
Russians
$107,295
MEDIAN FAMILY INCOME
91.4/ 100
METRIC RATING
125th/ 347
METRIC RANK
$120,487
MEDIAN FAMILY INCOME
100.0/ 100
METRIC RATING
27th/ 347
METRIC RANK
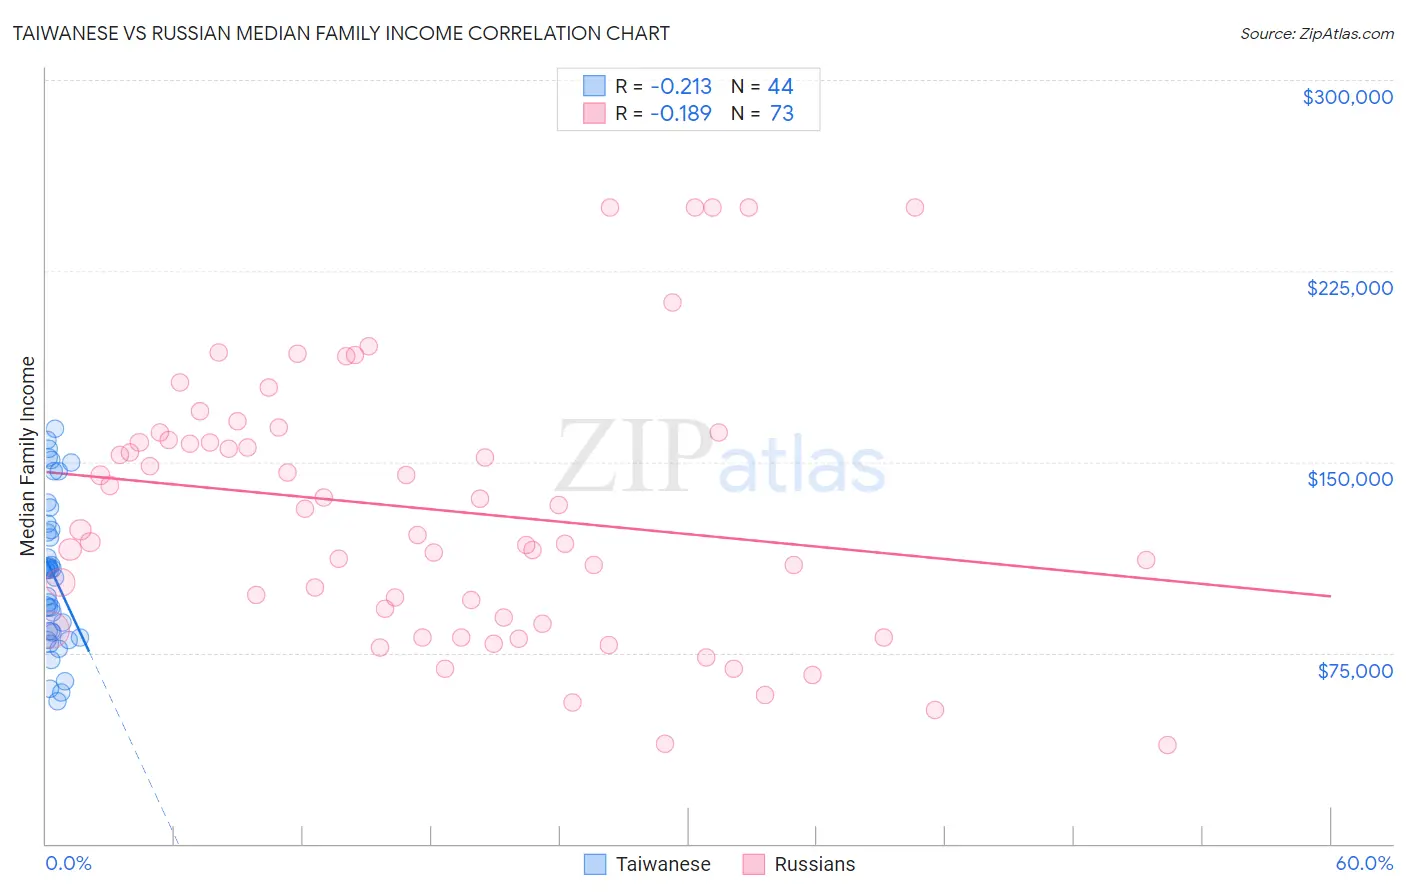
Taiwanese vs Russian Median Family Income Correlation Chart
The statistical analysis conducted on geographies consisting of 31,709,765 people shows a weak negative correlation between the proportion of Taiwanese and median family income in the United States with a correlation coefficient (R) of -0.213 and weighted average of $107,295. Similarly, the statistical analysis conducted on geographies consisting of 511,404,289 people shows a poor negative correlation between the proportion of Russians and median family income in the United States with a correlation coefficient (R) of -0.189 and weighted average of $120,487, a difference of 12.3%.
Median Family Income Correlation Summary
| Measurement | Taiwanese | Russian |
| Minimum | $56,146 | $38,939 |
| Maximum | $162,974 | $250,001 |
| Range | $106,828 | $211,062 |
| Mean | $106,094 | $131,214 |
| Median | $107,372 | $123,457 |
| Interquartile 25% (IQ1) | $83,038 | $87,492 |
| Interquartile 75% (IQ3) | $124,300 | $160,004 |
| Interquartile Range (IQR) | $41,262 | $72,512 |
| Standard Deviation (Sample) | $29,129 | $52,364 |
| Standard Deviation (Population) | $28,796 | $52,005 |
Similar Demographics by Median Family Income
Demographics Similar to Taiwanese by Median Family Income
In terms of median family income, the demographic groups most similar to Taiwanese are Pakistani ($107,390, a difference of 0.090%), Serbian ($107,157, a difference of 0.13%), Carpatho Rusyn ($107,502, a difference of 0.19%), Lebanese ($107,086, a difference of 0.19%), and Immigrants from Ethiopia ($106,969, a difference of 0.30%).
| Demographics | Rating | Rank | Median Family Income |
| Ethiopians | 94.5 /100 | #118 | Exceptional $108,251 |
| Sri Lankans | 94.5 /100 | #119 | Exceptional $108,234 |
| Immigrants | Northern Africa | 94.3 /100 | #120 | Exceptional $108,161 |
| Europeans | 94.1 /100 | #121 | Exceptional $108,099 |
| Immigrants | Jordan | 92.9 /100 | #122 | Exceptional $107,715 |
| Carpatho Rusyns | 92.2 /100 | #123 | Exceptional $107,502 |
| Pakistanis | 91.7 /100 | #124 | Exceptional $107,390 |
| Taiwanese | 91.4 /100 | #125 | Exceptional $107,295 |
| Serbians | 90.8 /100 | #126 | Exceptional $107,157 |
| Lebanese | 90.5 /100 | #127 | Exceptional $107,086 |
| Immigrants | Ethiopia | 90.0 /100 | #128 | Excellent $106,969 |
| Arabs | 89.9 /100 | #129 | Excellent $106,952 |
| Brazilians | 89.8 /100 | #130 | Excellent $106,942 |
| Canadians | 88.1 /100 | #131 | Excellent $106,597 |
| Immigrants | Fiji | 87.8 /100 | #132 | Excellent $106,544 |
Demographics Similar to Russians by Median Family Income
In terms of median family income, the demographic groups most similar to Russians are Immigrants from Denmark ($120,445, a difference of 0.040%), Latvian ($120,301, a difference of 0.15%), Immigrants from Sri Lanka ($120,263, a difference of 0.19%), Immigrants from Switzerland ($120,726, a difference of 0.20%), and Immigrants from France ($120,076, a difference of 0.34%).
| Demographics | Rating | Rank | Median Family Income |
| Burmese | 100.0 /100 | #20 | Exceptional $123,369 |
| Immigrants | Korea | 100.0 /100 | #21 | Exceptional $122,800 |
| Immigrants | Sweden | 100.0 /100 | #22 | Exceptional $122,765 |
| Immigrants | Japan | 100.0 /100 | #23 | Exceptional $122,764 |
| Immigrants | Northern Europe | 100.0 /100 | #24 | Exceptional $121,840 |
| Turks | 100.0 /100 | #25 | Exceptional $121,202 |
| Immigrants | Switzerland | 100.0 /100 | #26 | Exceptional $120,726 |
| Russians | 100.0 /100 | #27 | Exceptional $120,487 |
| Immigrants | Denmark | 100.0 /100 | #28 | Exceptional $120,445 |
| Latvians | 100.0 /100 | #29 | Exceptional $120,301 |
| Immigrants | Sri Lanka | 100.0 /100 | #30 | Exceptional $120,263 |
| Immigrants | France | 100.0 /100 | #31 | Exceptional $120,076 |
| Asians | 100.0 /100 | #32 | Exceptional $119,955 |
| Bhutanese | 100.0 /100 | #33 | Exceptional $119,800 |
| Bolivians | 100.0 /100 | #34 | Exceptional $119,479 |