Taiwanese vs Albanian Householder Income Ages 25 - 44 years
COMPARE
Taiwanese
Albanian
Householder Income Ages 25 - 44 years
Householder Income Ages 25 - 44 years Comparison
Taiwanese
Albanians
$101,492
HOUSEHOLDER INCOME AGES 25 - 44 YEARS
97.9/ 100
METRIC RATING
99th/ 347
METRIC RANK
$101,367
HOUSEHOLDER INCOME AGES 25 - 44 YEARS
97.8/ 100
METRIC RATING
101st/ 347
METRIC RANK
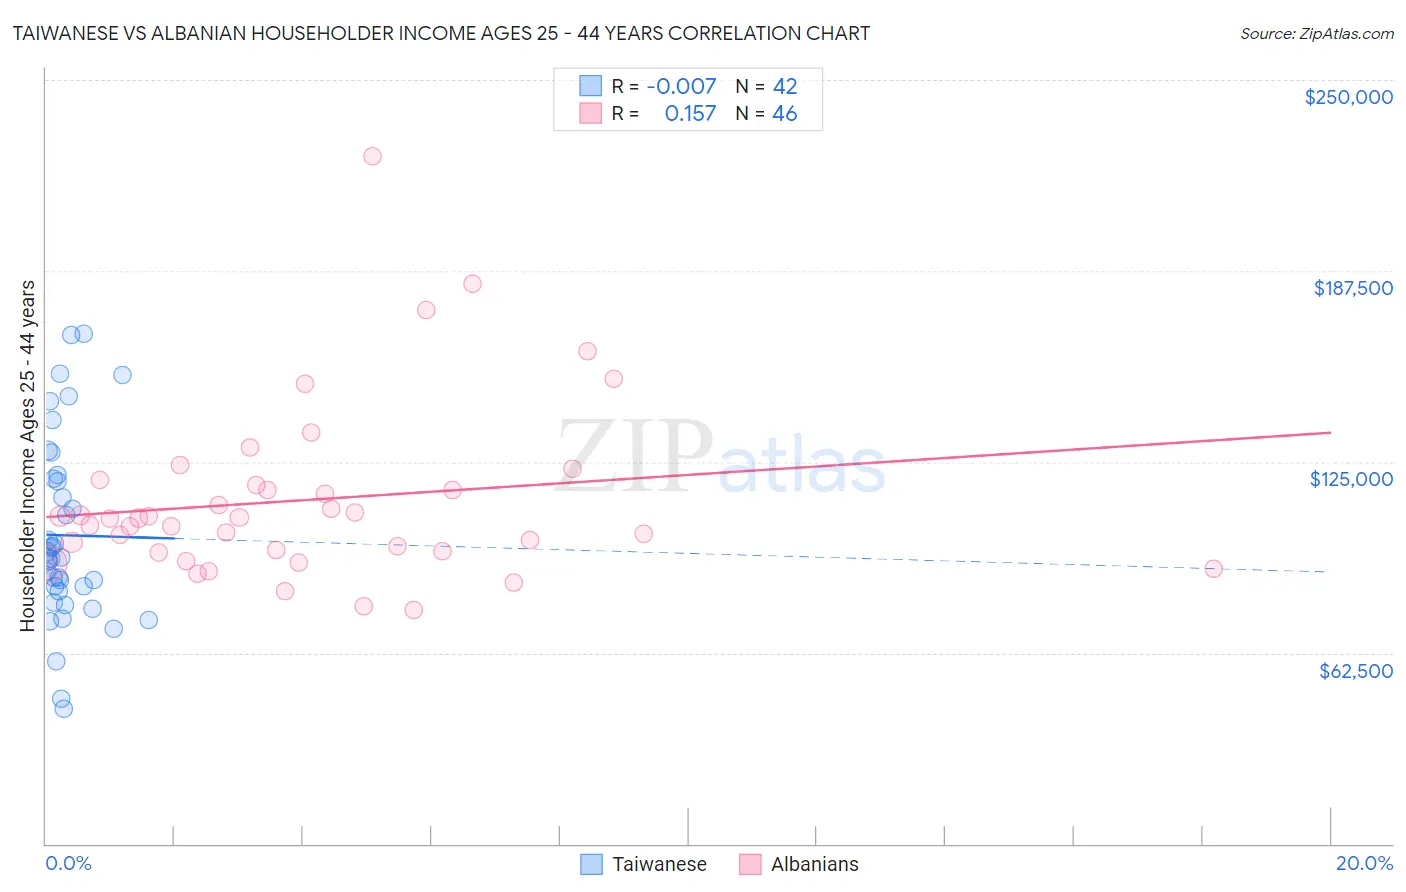
Taiwanese vs Albanian Householder Income Ages 25 - 44 years Correlation Chart
The statistical analysis conducted on geographies consisting of 31,707,824 people shows no correlation between the proportion of Taiwanese and household income with householder between the ages 25 and 44 in the United States with a correlation coefficient (R) of -0.007 and weighted average of $101,492. Similarly, the statistical analysis conducted on geographies consisting of 193,076,288 people shows a poor positive correlation between the proportion of Albanians and household income with householder between the ages 25 and 44 in the United States with a correlation coefficient (R) of 0.157 and weighted average of $101,367, a difference of 0.12%.
Householder Income Ages 25 - 44 years Correlation Summary
| Measurement | Taiwanese | Albanian |
| Minimum | $44,050 | $76,718 |
| Maximum | $166,985 | $225,000 |
| Range | $122,935 | $148,282 |
| Mean | $100,976 | $112,576 |
| Median | $93,672 | $106,494 |
| Interquartile 25% (IQ1) | $82,680 | $95,901 |
| Interquartile 75% (IQ3) | $119,346 | $117,313 |
| Interquartile Range (IQR) | $36,667 | $21,412 |
| Standard Deviation (Sample) | $30,133 | $28,766 |
| Standard Deviation (Population) | $29,772 | $28,452 |
Demographics Similar to Taiwanese and Albanians by Householder Income Ages 25 - 44 years
In terms of householder income ages 25 - 44 years, the demographic groups most similar to Taiwanese are Immigrants from Argentina ($101,415, a difference of 0.080%), Immigrants from Kazakhstan ($101,727, a difference of 0.23%), Austrian ($101,842, a difference of 0.35%), Immigrants from Lebanon ($101,124, a difference of 0.36%), and Macedonian ($101,882, a difference of 0.38%). Similarly, the demographic groups most similar to Albanians are Immigrants from Argentina ($101,415, a difference of 0.050%), Immigrants from Lebanon ($101,124, a difference of 0.24%), Immigrants from Moldova ($101,091, a difference of 0.27%), Immigrants from Poland ($101,065, a difference of 0.30%), and Immigrants from Kazakhstan ($101,727, a difference of 0.36%).
| Demographics | Rating | Rank | Householder Income Ages 25 - 44 years |
| Ukrainians | 98.8 /100 | #90 | Exceptional $102,451 |
| Croatians | 98.7 /100 | #91 | Exceptional $102,414 |
| Immigrants | North America | 98.7 /100 | #92 | Exceptional $102,407 |
| Immigrants | England | 98.4 /100 | #93 | Exceptional $102,020 |
| Sri Lankans | 98.4 /100 | #94 | Exceptional $101,960 |
| Assyrians/Chaldeans/Syriacs | 98.3 /100 | #95 | Exceptional $101,936 |
| Macedonians | 98.3 /100 | #96 | Exceptional $101,882 |
| Austrians | 98.3 /100 | #97 | Exceptional $101,842 |
| Immigrants | Kazakhstan | 98.1 /100 | #98 | Exceptional $101,727 |
| Taiwanese | 97.9 /100 | #99 | Exceptional $101,492 |
| Immigrants | Argentina | 97.8 /100 | #100 | Exceptional $101,415 |
| Albanians | 97.8 /100 | #101 | Exceptional $101,367 |
| Immigrants | Lebanon | 97.4 /100 | #102 | Exceptional $101,124 |
| Immigrants | Moldova | 97.4 /100 | #103 | Exceptional $101,091 |
| Immigrants | Poland | 97.4 /100 | #104 | Exceptional $101,065 |
| Immigrants | Vietnam | 96.5 /100 | #105 | Exceptional $100,535 |
| Immigrants | Brazil | 96.5 /100 | #106 | Exceptional $100,534 |
| Northern Europeans | 96.3 /100 | #107 | Exceptional $100,457 |
| Immigrants | South Eastern Asia | 96.0 /100 | #108 | Exceptional $100,283 |
| Immigrants | North Macedonia | 95.6 /100 | #109 | Exceptional $100,101 |
| Immigrants | Afghanistan | 95.3 /100 | #110 | Exceptional $99,977 |