Immigrants from Northern Africa vs Albanian Householder Income Ages 25 - 44 years
COMPARE
Immigrants from Northern Africa
Albanian
Householder Income Ages 25 - 44 years
Householder Income Ages 25 - 44 years Comparison
Immigrants from Northern Africa
Albanians
$99,232
HOUSEHOLDER INCOME AGES 25 - 44 YEARS
93.0/ 100
METRIC RATING
117th/ 347
METRIC RANK
$101,367
HOUSEHOLDER INCOME AGES 25 - 44 YEARS
97.8/ 100
METRIC RATING
101st/ 347
METRIC RANK
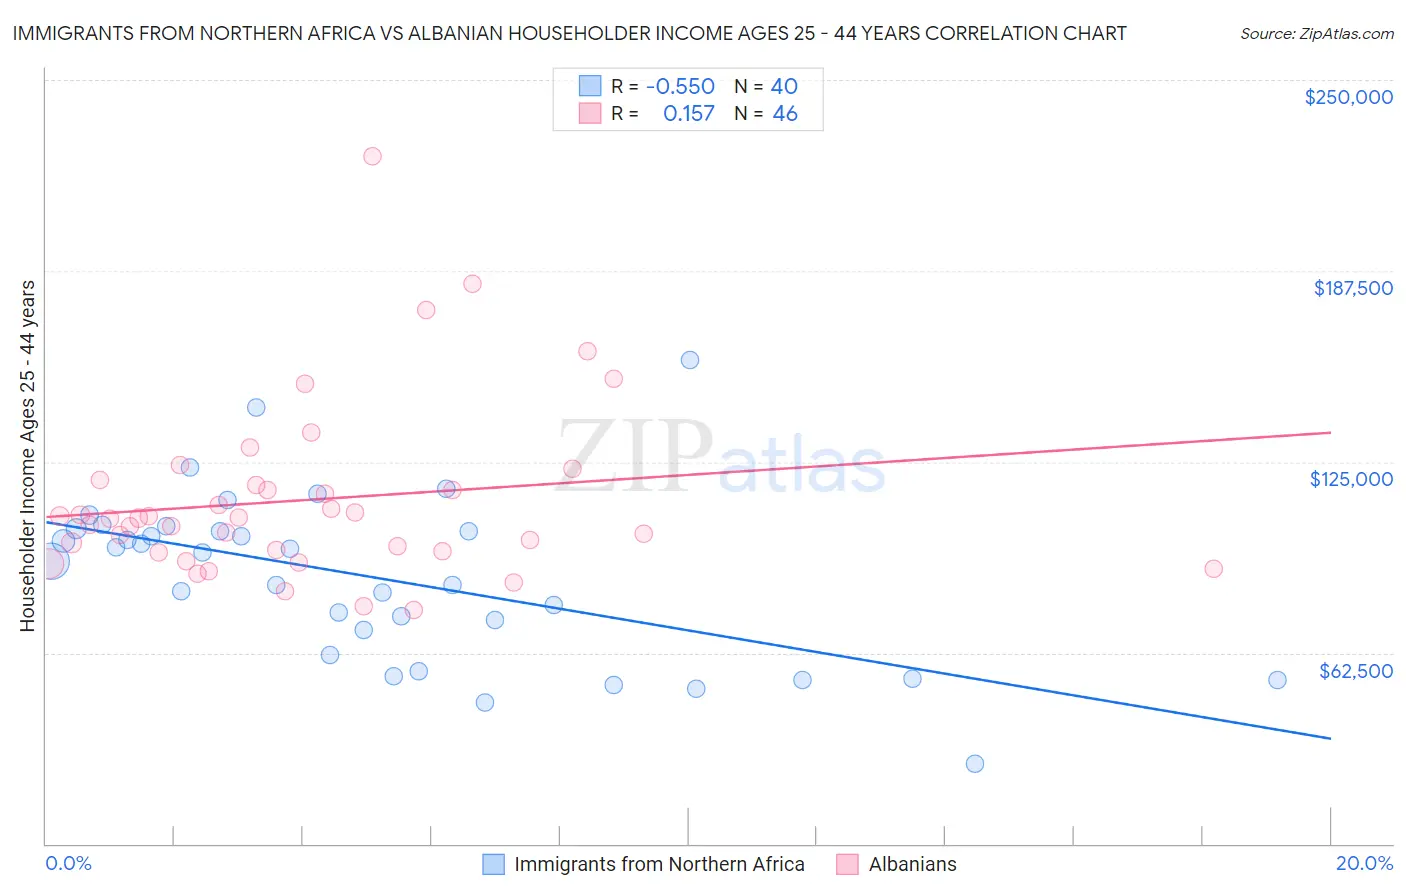
Immigrants from Northern Africa vs Albanian Householder Income Ages 25 - 44 years Correlation Chart
The statistical analysis conducted on geographies consisting of 320,605,097 people shows a substantial negative correlation between the proportion of Immigrants from Northern Africa and household income with householder between the ages 25 and 44 in the United States with a correlation coefficient (R) of -0.550 and weighted average of $99,232. Similarly, the statistical analysis conducted on geographies consisting of 193,076,288 people shows a poor positive correlation between the proportion of Albanians and household income with householder between the ages 25 and 44 in the United States with a correlation coefficient (R) of 0.157 and weighted average of $101,367, a difference of 2.1%.
Householder Income Ages 25 - 44 years Correlation Summary
| Measurement | Immigrants from Northern Africa | Albanian |
| Minimum | $26,250 | $76,718 |
| Maximum | $158,487 | $225,000 |
| Range | $132,237 | $148,282 |
| Mean | $87,149 | $112,576 |
| Median | $93,767 | $106,494 |
| Interquartile 25% (IQ1) | $65,886 | $95,901 |
| Interquartile 75% (IQ3) | $102,671 | $117,313 |
| Interquartile Range (IQR) | $36,785 | $21,412 |
| Standard Deviation (Sample) | $27,415 | $28,766 |
| Standard Deviation (Population) | $27,070 | $28,452 |
Demographics Similar to Immigrants from Northern Africa and Albanians by Householder Income Ages 25 - 44 years
In terms of householder income ages 25 - 44 years, the demographic groups most similar to Immigrants from Northern Africa are Syrian ($99,215, a difference of 0.020%), Jordanian ($99,186, a difference of 0.050%), Portuguese ($99,429, a difference of 0.20%), Carpatho Rusyn ($99,449, a difference of 0.22%), and Immigrants from Western Asia ($99,516, a difference of 0.29%). Similarly, the demographic groups most similar to Albanians are Immigrants from Argentina ($101,415, a difference of 0.050%), Taiwanese ($101,492, a difference of 0.12%), Immigrants from Lebanon ($101,124, a difference of 0.24%), Immigrants from Moldova ($101,091, a difference of 0.27%), and Immigrants from Poland ($101,065, a difference of 0.30%).
| Demographics | Rating | Rank | Householder Income Ages 25 - 44 years |
| Taiwanese | 97.9 /100 | #99 | Exceptional $101,492 |
| Immigrants | Argentina | 97.8 /100 | #100 | Exceptional $101,415 |
| Albanians | 97.8 /100 | #101 | Exceptional $101,367 |
| Immigrants | Lebanon | 97.4 /100 | #102 | Exceptional $101,124 |
| Immigrants | Moldova | 97.4 /100 | #103 | Exceptional $101,091 |
| Immigrants | Poland | 97.4 /100 | #104 | Exceptional $101,065 |
| Immigrants | Vietnam | 96.5 /100 | #105 | Exceptional $100,535 |
| Immigrants | Brazil | 96.5 /100 | #106 | Exceptional $100,534 |
| Northern Europeans | 96.3 /100 | #107 | Exceptional $100,457 |
| Immigrants | South Eastern Asia | 96.0 /100 | #108 | Exceptional $100,283 |
| Immigrants | North Macedonia | 95.6 /100 | #109 | Exceptional $100,101 |
| Immigrants | Afghanistan | 95.3 /100 | #110 | Exceptional $99,977 |
| Chileans | 95.1 /100 | #111 | Exceptional $99,900 |
| Poles | 94.5 /100 | #112 | Exceptional $99,685 |
| Tongans | 94.2 /100 | #113 | Exceptional $99,604 |
| Immigrants | Western Asia | 94.0 /100 | #114 | Exceptional $99,516 |
| Carpatho Rusyns | 93.7 /100 | #115 | Exceptional $99,449 |
| Portuguese | 93.7 /100 | #116 | Exceptional $99,429 |
| Immigrants | Northern Africa | 93.0 /100 | #117 | Exceptional $99,232 |
| Syrians | 92.9 /100 | #118 | Exceptional $99,215 |
| Jordanians | 92.8 /100 | #119 | Exceptional $99,186 |