Syrian vs Immigrants from Sri Lanka Householder Income Ages 45 - 64 years
COMPARE
Syrian
Immigrants from Sri Lanka
Householder Income Ages 45 - 64 years
Householder Income Ages 45 - 64 years Comparison
Syrians
Immigrants from Sri Lanka
$107,207
HOUSEHOLDER INCOME AGES 45 - 64 YEARS
96.9/ 100
METRIC RATING
103rd/ 347
METRIC RANK
$119,094
HOUSEHOLDER INCOME AGES 45 - 64 YEARS
100.0/ 100
METRIC RATING
21st/ 347
METRIC RANK
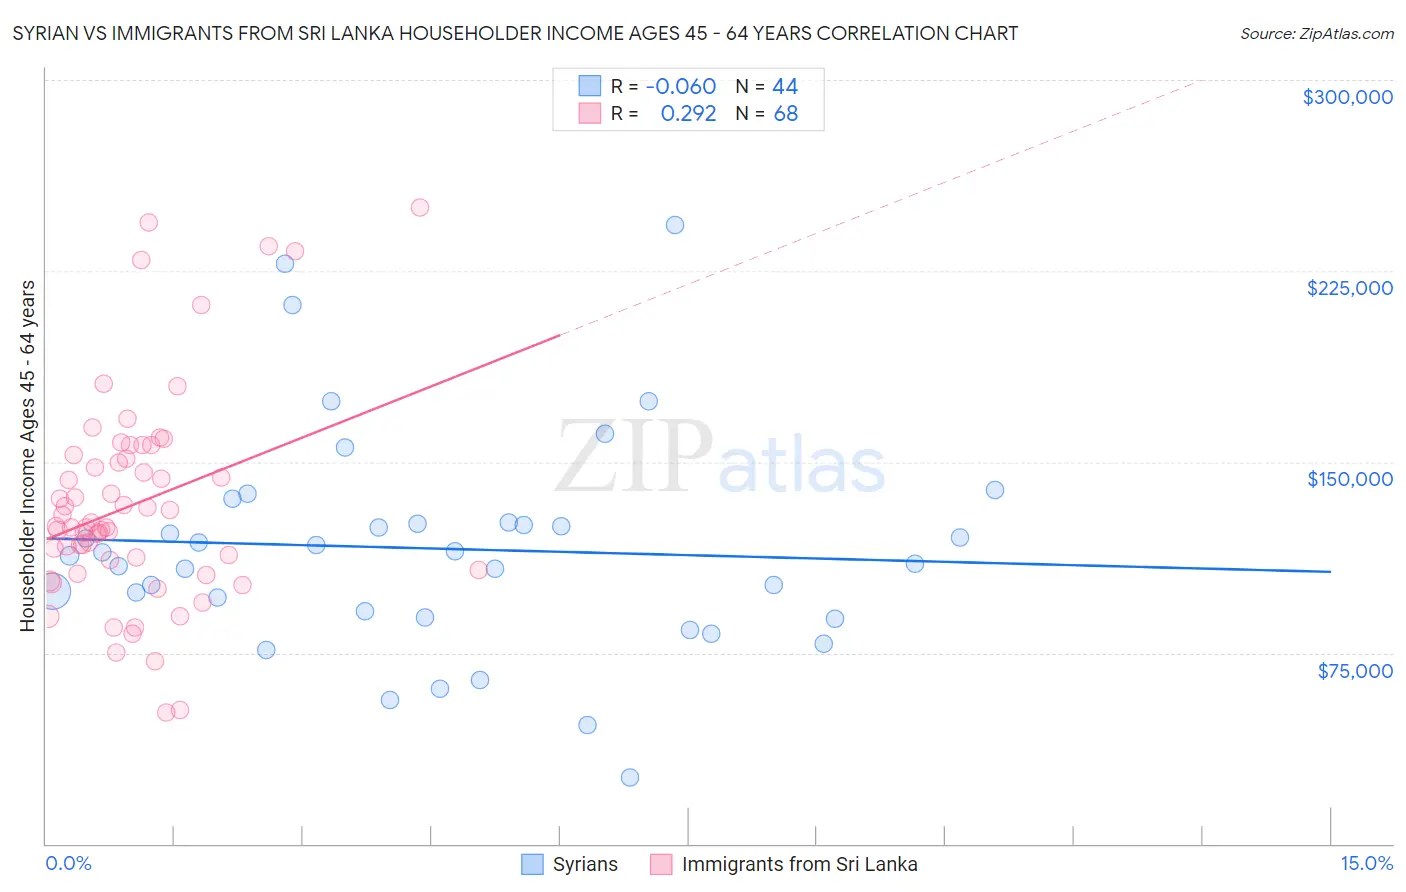
Syrian vs Immigrants from Sri Lanka Householder Income Ages 45 - 64 years Correlation Chart
The statistical analysis conducted on geographies consisting of 266,033,400 people shows a slight negative correlation between the proportion of Syrians and household income with householder between the ages 45 and 64 in the United States with a correlation coefficient (R) of -0.060 and weighted average of $107,207. Similarly, the statistical analysis conducted on geographies consisting of 149,646,211 people shows a weak positive correlation between the proportion of Immigrants from Sri Lanka and household income with householder between the ages 45 and 64 in the United States with a correlation coefficient (R) of 0.292 and weighted average of $119,094, a difference of 11.1%.
Householder Income Ages 45 - 64 years Correlation Summary
| Measurement | Syrian | Immigrants from Sri Lanka |
| Minimum | $25,909 | $51,635 |
| Maximum | $243,024 | $250,001 |
| Range | $217,115 | $198,366 |
| Mean | $115,941 | $133,379 |
| Median | $113,826 | $124,481 |
| Interquartile 25% (IQ1) | $89,983 | $109,443 |
| Interquartile 75% (IQ3) | $126,144 | $152,000 |
| Interquartile Range (IQR) | $36,161 | $42,557 |
| Standard Deviation (Sample) | $43,404 | $41,610 |
| Standard Deviation (Population) | $42,908 | $41,303 |
Similar Demographics by Householder Income Ages 45 - 64 years
Demographics Similar to Syrians by Householder Income Ages 45 - 64 years
In terms of householder income ages 45 - 64 years, the demographic groups most similar to Syrians are Immigrants from Ukraine ($107,079, a difference of 0.12%), Macedonian ($107,074, a difference of 0.12%), Immigrants from Moldova ($107,357, a difference of 0.14%), Immigrants from Kazakhstan ($107,378, a difference of 0.16%), and Armenian ($107,002, a difference of 0.19%).
| Demographics | Rating | Rank | Householder Income Ages 45 - 64 years |
| Immigrants | Argentina | 98.2 /100 | #96 | Exceptional $108,264 |
| Northern Europeans | 97.8 /100 | #97 | Exceptional $107,870 |
| Immigrants | Southern Europe | 97.7 /100 | #98 | Exceptional $107,775 |
| Palestinians | 97.6 /100 | #99 | Exceptional $107,721 |
| Immigrants | Serbia | 97.4 /100 | #100 | Exceptional $107,569 |
| Immigrants | Kazakhstan | 97.2 /100 | #101 | Exceptional $107,378 |
| Immigrants | Moldova | 97.1 /100 | #102 | Exceptional $107,357 |
| Syrians | 96.9 /100 | #103 | Exceptional $107,207 |
| Immigrants | Ukraine | 96.7 /100 | #104 | Exceptional $107,079 |
| Macedonians | 96.7 /100 | #105 | Exceptional $107,074 |
| Armenians | 96.6 /100 | #106 | Exceptional $107,002 |
| Immigrants | Fiji | 96.5 /100 | #107 | Exceptional $106,952 |
| Zimbabweans | 96.3 /100 | #108 | Exceptional $106,849 |
| Chileans | 95.9 /100 | #109 | Exceptional $106,611 |
| Immigrants | Brazil | 95.6 /100 | #110 | Exceptional $106,470 |
Demographics Similar to Immigrants from Sri Lanka by Householder Income Ages 45 - 64 years
In terms of householder income ages 45 - 64 years, the demographic groups most similar to Immigrants from Sri Lanka are Immigrants from Belgium ($118,932, a difference of 0.14%), Immigrants from Australia ($119,308, a difference of 0.18%), Bolivian ($118,871, a difference of 0.19%), Immigrants from Japan ($118,498, a difference of 0.50%), and Asian ($118,426, a difference of 0.56%).
| Demographics | Rating | Rank | Householder Income Ages 45 - 64 years |
| Indians (Asian) | 100.0 /100 | #14 | Exceptional $122,343 |
| Immigrants | Eastern Asia | 100.0 /100 | #15 | Exceptional $122,222 |
| Immigrants | China | 100.0 /100 | #16 | Exceptional $122,178 |
| Burmese | 100.0 /100 | #17 | Exceptional $121,444 |
| Immigrants | Korea | 100.0 /100 | #18 | Exceptional $121,243 |
| Eastern Europeans | 100.0 /100 | #19 | Exceptional $120,684 |
| Immigrants | Australia | 100.0 /100 | #20 | Exceptional $119,308 |
| Immigrants | Sri Lanka | 100.0 /100 | #21 | Exceptional $119,094 |
| Immigrants | Belgium | 100.0 /100 | #22 | Exceptional $118,932 |
| Bolivians | 100.0 /100 | #23 | Exceptional $118,871 |
| Immigrants | Japan | 100.0 /100 | #24 | Exceptional $118,498 |
| Asians | 100.0 /100 | #25 | Exceptional $118,426 |
| Immigrants | Sweden | 100.0 /100 | #26 | Exceptional $118,318 |
| Immigrants | Northern Europe | 100.0 /100 | #27 | Exceptional $117,930 |
| Turks | 100.0 /100 | #28 | Exceptional $117,814 |