Syrian vs Venezuelan Householder Income Ages 45 - 64 years
COMPARE
Syrian
Venezuelan
Householder Income Ages 45 - 64 years
Householder Income Ages 45 - 64 years Comparison
Syrians
Venezuelans
$107,207
HOUSEHOLDER INCOME AGES 45 - 64 YEARS
96.9/ 100
METRIC RATING
103rd/ 347
METRIC RANK
$96,460
HOUSEHOLDER INCOME AGES 45 - 64 YEARS
12.6/ 100
METRIC RATING
212th/ 347
METRIC RANK
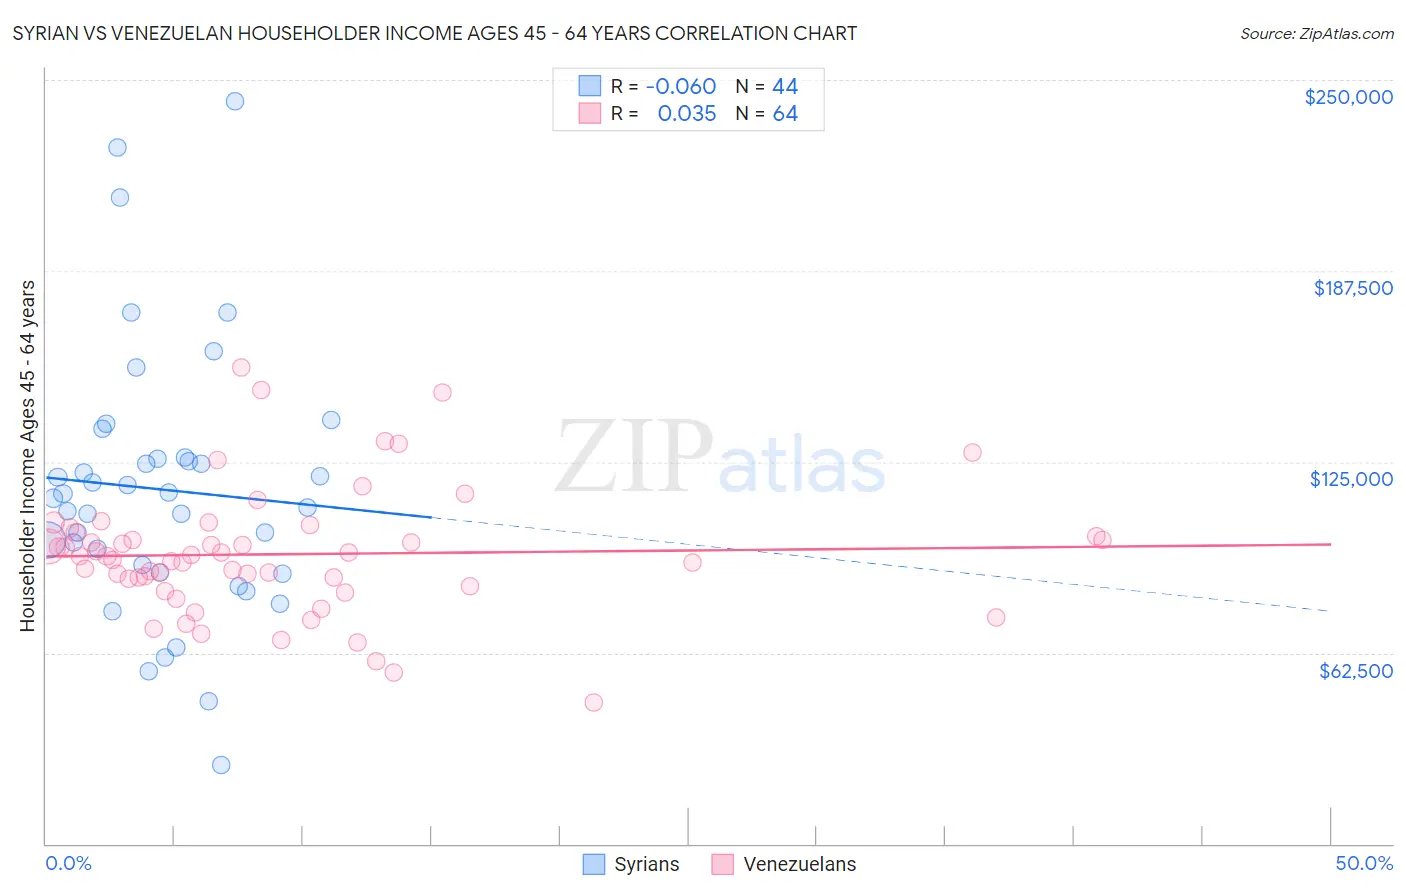
Syrian vs Venezuelan Householder Income Ages 45 - 64 years Correlation Chart
The statistical analysis conducted on geographies consisting of 266,033,400 people shows a slight negative correlation between the proportion of Syrians and household income with householder between the ages 45 and 64 in the United States with a correlation coefficient (R) of -0.060 and weighted average of $107,207. Similarly, the statistical analysis conducted on geographies consisting of 305,898,329 people shows no correlation between the proportion of Venezuelans and household income with householder between the ages 45 and 64 in the United States with a correlation coefficient (R) of 0.035 and weighted average of $96,460, a difference of 11.1%.
Householder Income Ages 45 - 64 years Correlation Summary
| Measurement | Syrian | Venezuelan |
| Minimum | $25,909 | $46,250 |
| Maximum | $243,024 | $155,899 |
| Range | $217,115 | $109,649 |
| Mean | $115,941 | $94,776 |
| Median | $113,826 | $94,033 |
| Interquartile 25% (IQ1) | $89,983 | $85,499 |
| Interquartile 75% (IQ3) | $126,144 | $101,274 |
| Interquartile Range (IQR) | $36,161 | $15,775 |
| Standard Deviation (Sample) | $43,404 | $20,798 |
| Standard Deviation (Population) | $42,908 | $20,635 |
Similar Demographics by Householder Income Ages 45 - 64 years
Demographics Similar to Syrians by Householder Income Ages 45 - 64 years
In terms of householder income ages 45 - 64 years, the demographic groups most similar to Syrians are Immigrants from Ukraine ($107,079, a difference of 0.12%), Macedonian ($107,074, a difference of 0.12%), Immigrants from Moldova ($107,357, a difference of 0.14%), Immigrants from Kazakhstan ($107,378, a difference of 0.16%), and Armenian ($107,002, a difference of 0.19%).
| Demographics | Rating | Rank | Householder Income Ages 45 - 64 years |
| Immigrants | Argentina | 98.2 /100 | #96 | Exceptional $108,264 |
| Northern Europeans | 97.8 /100 | #97 | Exceptional $107,870 |
| Immigrants | Southern Europe | 97.7 /100 | #98 | Exceptional $107,775 |
| Palestinians | 97.6 /100 | #99 | Exceptional $107,721 |
| Immigrants | Serbia | 97.4 /100 | #100 | Exceptional $107,569 |
| Immigrants | Kazakhstan | 97.2 /100 | #101 | Exceptional $107,378 |
| Immigrants | Moldova | 97.1 /100 | #102 | Exceptional $107,357 |
| Syrians | 96.9 /100 | #103 | Exceptional $107,207 |
| Immigrants | Ukraine | 96.7 /100 | #104 | Exceptional $107,079 |
| Macedonians | 96.7 /100 | #105 | Exceptional $107,074 |
| Armenians | 96.6 /100 | #106 | Exceptional $107,002 |
| Immigrants | Fiji | 96.5 /100 | #107 | Exceptional $106,952 |
| Zimbabweans | 96.3 /100 | #108 | Exceptional $106,849 |
| Chileans | 95.9 /100 | #109 | Exceptional $106,611 |
| Immigrants | Brazil | 95.6 /100 | #110 | Exceptional $106,470 |
Demographics Similar to Venezuelans by Householder Income Ages 45 - 64 years
In terms of householder income ages 45 - 64 years, the demographic groups most similar to Venezuelans are Immigrants from Cambodia ($96,537, a difference of 0.080%), Tsimshian ($96,783, a difference of 0.34%), Japanese ($96,834, a difference of 0.39%), Immigrants from Uruguay ($96,086, a difference of 0.39%), and Panamanian ($96,066, a difference of 0.41%).
| Demographics | Rating | Rank | Householder Income Ages 45 - 64 years |
| Immigrants | Colombia | 18.0 /100 | #205 | Poor $97,290 |
| Immigrants | Africa | 17.9 /100 | #206 | Poor $97,284 |
| Ghanaians | 17.9 /100 | #207 | Poor $97,277 |
| Scotch-Irish | 16.4 /100 | #208 | Poor $97,073 |
| Japanese | 14.8 /100 | #209 | Poor $96,834 |
| Tsimshian | 14.5 /100 | #210 | Poor $96,783 |
| Immigrants | Cambodia | 13.0 /100 | #211 | Poor $96,537 |
| Venezuelans | 12.6 /100 | #212 | Poor $96,460 |
| Immigrants | Uruguay | 10.7 /100 | #213 | Poor $96,086 |
| Panamanians | 10.6 /100 | #214 | Poor $96,066 |
| Nigerians | 8.2 /100 | #215 | Tragic $95,492 |
| Immigrants | Venezuela | 7.6 /100 | #216 | Tragic $95,342 |
| Immigrants | Ghana | 6.4 /100 | #217 | Tragic $94,982 |
| Delaware | 6.2 /100 | #218 | Tragic $94,914 |
| Immigrants | Armenia | 6.1 /100 | #219 | Tragic $94,863 |