Syrian vs Puget Sound Salish Householder Income Ages 25 - 44 years
COMPARE
Syrian
Puget Sound Salish
Householder Income Ages 25 - 44 years
Householder Income Ages 25 - 44 years Comparison
Syrians
Puget Sound Salish
$99,215
HOUSEHOLDER INCOME AGES 25 - 44 YEARS
92.9/ 100
METRIC RATING
118th/ 347
METRIC RANK
$93,661
HOUSEHOLDER INCOME AGES 25 - 44 YEARS
37.7/ 100
METRIC RATING
181st/ 347
METRIC RANK
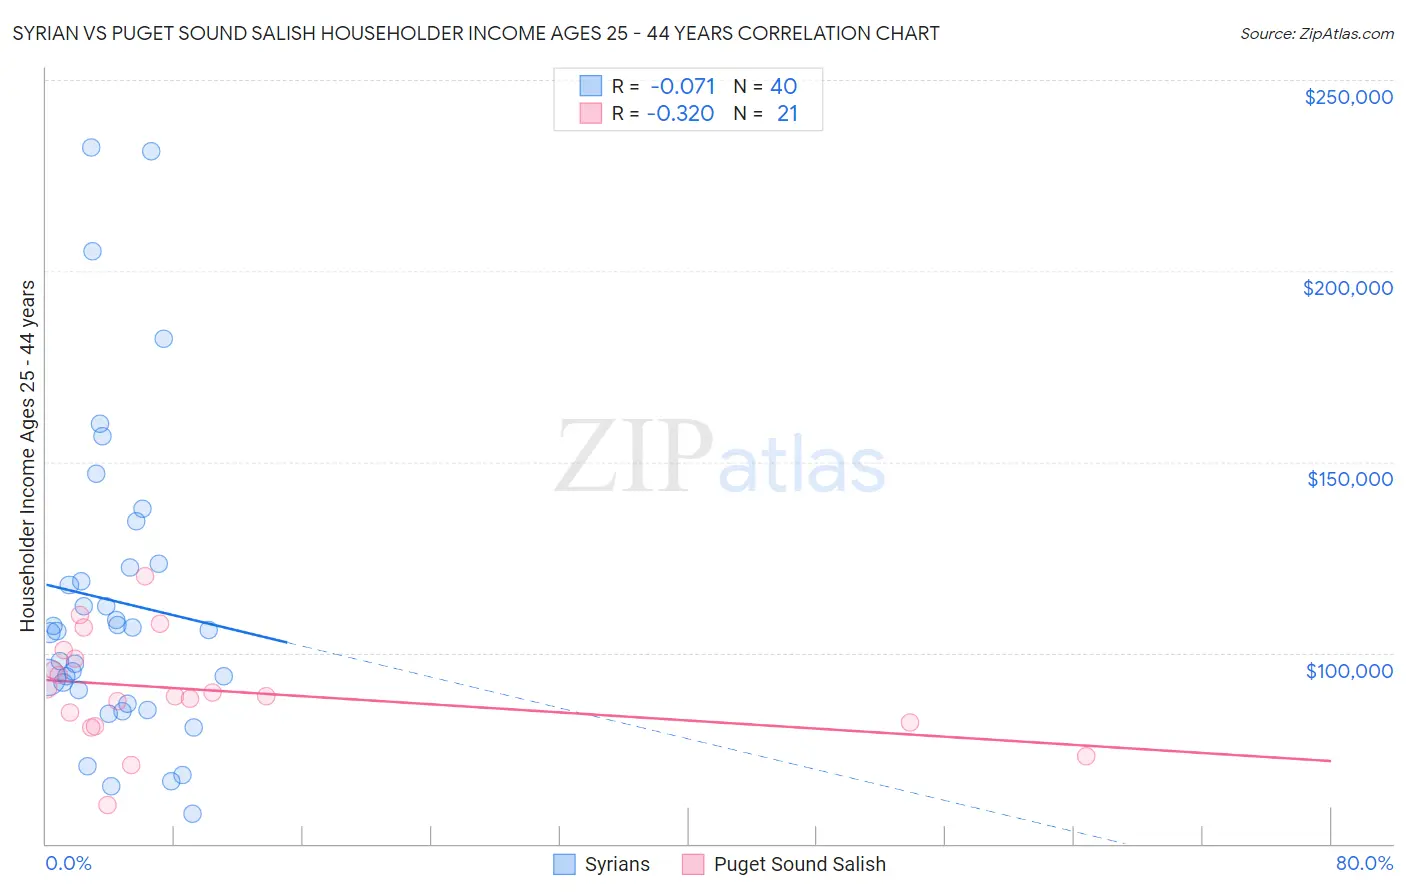
Syrian vs Puget Sound Salish Householder Income Ages 25 - 44 years Correlation Chart
The statistical analysis conducted on geographies consisting of 265,710,872 people shows a slight negative correlation between the proportion of Syrians and household income with householder between the ages 25 and 44 in the United States with a correlation coefficient (R) of -0.071 and weighted average of $99,215. Similarly, the statistical analysis conducted on geographies consisting of 46,117,384 people shows a mild negative correlation between the proportion of Puget Sound Salish and household income with householder between the ages 25 and 44 in the United States with a correlation coefficient (R) of -0.320 and weighted average of $93,661, a difference of 5.9%.
Householder Income Ages 25 - 44 years Correlation Summary
| Measurement | Syrian | Puget Sound Salish |
| Minimum | $57,774 | $60,054 |
| Maximum | $232,386 | $120,094 |
| Range | $174,612 | $60,040 |
| Mean | $113,575 | $90,323 |
| Median | $105,902 | $88,500 |
| Interquartile 25% (IQ1) | $88,495 | $81,286 |
| Interquartile 75% (IQ3) | $122,954 | $99,556 |
| Interquartile Range (IQR) | $34,460 | $18,270 |
| Standard Deviation (Sample) | $41,385 | $14,089 |
| Standard Deviation (Population) | $40,865 | $13,749 |
Similar Demographics by Householder Income Ages 25 - 44 years
Demographics Similar to Syrians by Householder Income Ages 25 - 44 years
In terms of householder income ages 25 - 44 years, the demographic groups most similar to Syrians are Immigrants from Northern Africa ($99,232, a difference of 0.020%), Jordanian ($99,186, a difference of 0.030%), Swedish ($99,136, a difference of 0.080%), Portuguese ($99,429, a difference of 0.22%), and Carpatho Rusyn ($99,449, a difference of 0.24%).
| Demographics | Rating | Rank | Householder Income Ages 25 - 44 years |
| Chileans | 95.1 /100 | #111 | Exceptional $99,900 |
| Poles | 94.5 /100 | #112 | Exceptional $99,685 |
| Tongans | 94.2 /100 | #113 | Exceptional $99,604 |
| Immigrants | Western Asia | 94.0 /100 | #114 | Exceptional $99,516 |
| Carpatho Rusyns | 93.7 /100 | #115 | Exceptional $99,449 |
| Portuguese | 93.7 /100 | #116 | Exceptional $99,429 |
| Immigrants | Northern Africa | 93.0 /100 | #117 | Exceptional $99,232 |
| Syrians | 92.9 /100 | #118 | Exceptional $99,215 |
| Jordanians | 92.8 /100 | #119 | Exceptional $99,186 |
| Swedes | 92.7 /100 | #120 | Exceptional $99,136 |
| Peruvians | 91.7 /100 | #121 | Exceptional $98,886 |
| Immigrants | Uzbekistan | 91.5 /100 | #122 | Exceptional $98,849 |
| Palestinians | 91.2 /100 | #123 | Exceptional $98,777 |
| Zimbabweans | 90.3 /100 | #124 | Exceptional $98,586 |
| Pakistanis | 89.3 /100 | #125 | Excellent $98,401 |
Demographics Similar to Puget Sound Salish by Householder Income Ages 25 - 44 years
In terms of householder income ages 25 - 44 years, the demographic groups most similar to Puget Sound Salish are French ($93,665, a difference of 0.0%), Uruguayan ($93,631, a difference of 0.030%), French Canadian ($93,694, a difference of 0.040%), Guamanian/Chamorro ($93,569, a difference of 0.10%), and German ($93,531, a difference of 0.14%).
| Demographics | Rating | Rank | Householder Income Ages 25 - 44 years |
| Colombians | 50.0 /100 | #174 | Average $94,565 |
| English | 48.1 /100 | #175 | Average $94,429 |
| Immigrants | Immigrants | 48.0 /100 | #176 | Average $94,423 |
| Belgians | 45.8 /100 | #177 | Average $94,262 |
| Immigrants | South America | 42.8 /100 | #178 | Average $94,042 |
| French Canadians | 38.2 /100 | #179 | Fair $93,694 |
| French | 37.8 /100 | #180 | Fair $93,665 |
| Puget Sound Salish | 37.7 /100 | #181 | Fair $93,661 |
| Uruguayans | 37.3 /100 | #182 | Fair $93,631 |
| Guamanians/Chamorros | 36.5 /100 | #183 | Fair $93,569 |
| Germans | 36.0 /100 | #184 | Fair $93,531 |
| Immigrants | Eritrea | 35.2 /100 | #185 | Fair $93,466 |
| Sierra Leoneans | 34.8 /100 | #186 | Fair $93,435 |
| Spaniards | 34.0 /100 | #187 | Fair $93,366 |
| Immigrants | Sierra Leone | 30.9 /100 | #188 | Fair $93,115 |