Immigrants from Cameroon vs Ugandan Householder Income Ages 25 - 44 years
COMPARE
Immigrants from Cameroon
Ugandan
Householder Income Ages 25 - 44 years
Householder Income Ages 25 - 44 years Comparison
Immigrants from Cameroon
Ugandans
$88,214
HOUSEHOLDER INCOME AGES 25 - 44 YEARS
2.9/ 100
METRIC RATING
236th/ 347
METRIC RANK
$96,667
HOUSEHOLDER INCOME AGES 25 - 44 YEARS
76.2/ 100
METRIC RATING
150th/ 347
METRIC RANK
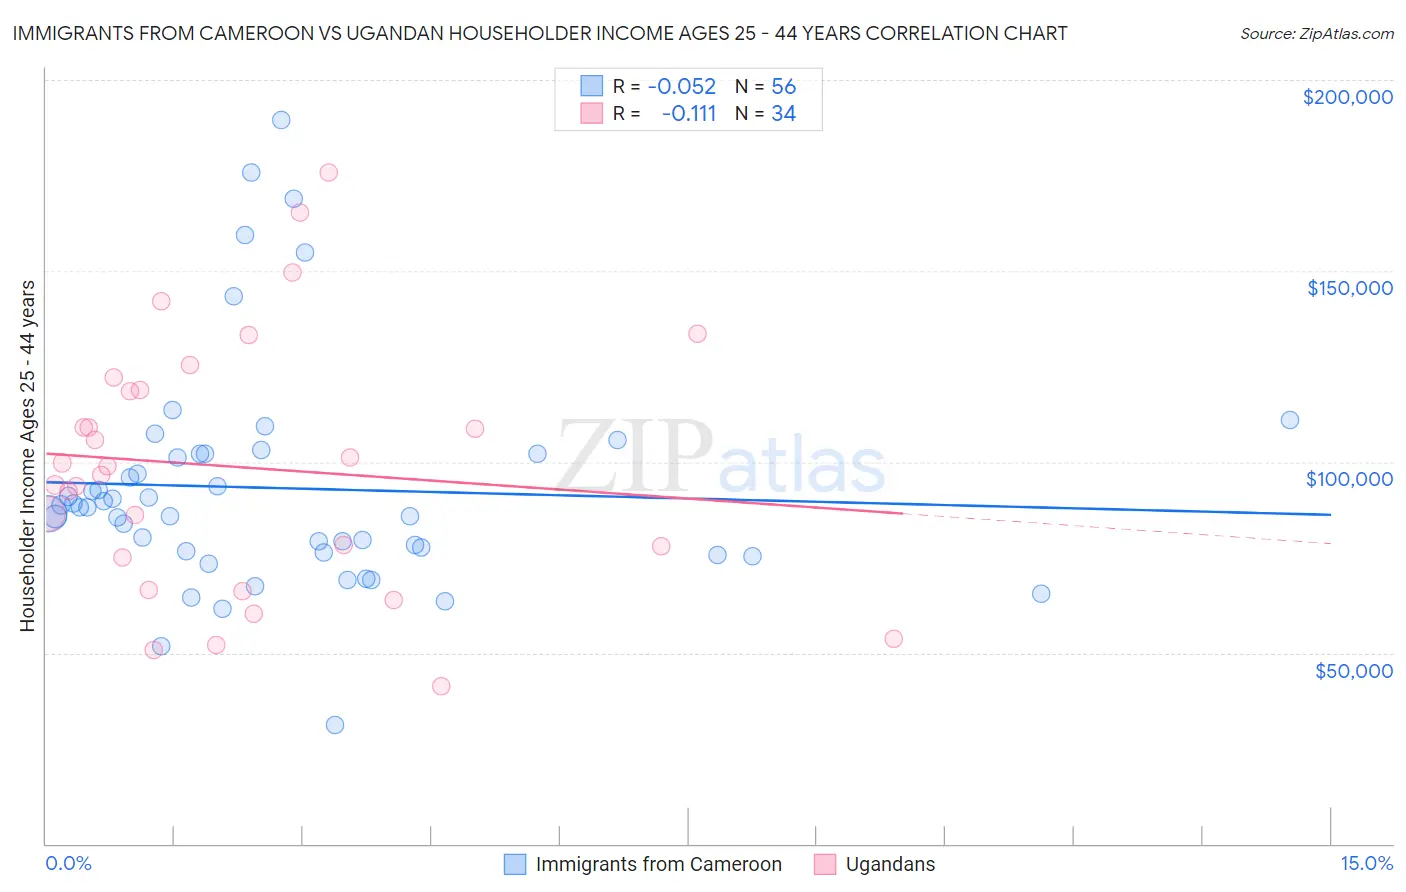
Immigrants from Cameroon vs Ugandan Householder Income Ages 25 - 44 years Correlation Chart
The statistical analysis conducted on geographies consisting of 130,701,481 people shows a slight negative correlation between the proportion of Immigrants from Cameroon and household income with householder between the ages 25 and 44 in the United States with a correlation coefficient (R) of -0.052 and weighted average of $88,214. Similarly, the statistical analysis conducted on geographies consisting of 93,976,499 people shows a poor negative correlation between the proportion of Ugandans and household income with householder between the ages 25 and 44 in the United States with a correlation coefficient (R) of -0.111 and weighted average of $96,667, a difference of 9.6%.
Householder Income Ages 25 - 44 years Correlation Summary
| Measurement | Immigrants from Cameroon | Ugandan |
| Minimum | $31,250 | $41,159 |
| Maximum | $189,447 | $175,893 |
| Range | $158,197 | $134,734 |
| Mean | $93,103 | $98,580 |
| Median | $88,029 | $97,758 |
| Interquartile 25% (IQ1) | $76,496 | $74,874 |
| Interquartile 75% (IQ3) | $102,206 | $118,938 |
| Interquartile Range (IQR) | $25,711 | $44,063 |
| Standard Deviation (Sample) | $29,847 | $33,089 |
| Standard Deviation (Population) | $29,580 | $32,599 |
Similar Demographics by Householder Income Ages 25 - 44 years
Demographics Similar to Immigrants from Cameroon by Householder Income Ages 25 - 44 years
In terms of householder income ages 25 - 44 years, the demographic groups most similar to Immigrants from Cameroon are Venezuelan ($88,232, a difference of 0.020%), Bermudan ($88,231, a difference of 0.020%), Salvadoran ($88,198, a difference of 0.020%), Malaysian ($88,291, a difference of 0.090%), and Nonimmigrants ($88,301, a difference of 0.10%).
| Demographics | Rating | Rank | Householder Income Ages 25 - 44 years |
| Immigrants | Barbados | 3.7 /100 | #229 | Tragic $88,687 |
| Alaskan Athabascans | 3.3 /100 | #230 | Tragic $88,446 |
| Immigrants | Grenada | 3.0 /100 | #231 | Tragic $88,311 |
| Immigrants | Nonimmigrants | 3.0 /100 | #232 | Tragic $88,301 |
| Malaysians | 3.0 /100 | #233 | Tragic $88,291 |
| Venezuelans | 2.9 /100 | #234 | Tragic $88,232 |
| Bermudans | 2.9 /100 | #235 | Tragic $88,231 |
| Immigrants | Cameroon | 2.9 /100 | #236 | Tragic $88,214 |
| Salvadorans | 2.8 /100 | #237 | Tragic $88,198 |
| Alaska Natives | 2.6 /100 | #238 | Tragic $88,018 |
| Immigrants | Ghana | 2.2 /100 | #239 | Tragic $87,760 |
| Nicaraguans | 2.2 /100 | #240 | Tragic $87,751 |
| Nigerians | 2.2 /100 | #241 | Tragic $87,730 |
| West Indians | 1.7 /100 | #242 | Tragic $87,205 |
| Immigrants | West Indies | 1.5 /100 | #243 | Tragic $87,063 |
Demographics Similar to Ugandans by Householder Income Ages 25 - 44 years
In terms of householder income ages 25 - 44 years, the demographic groups most similar to Ugandans are Basque ($96,709, a difference of 0.040%), Irish ($96,730, a difference of 0.070%), Immigrants from Syria ($96,789, a difference of 0.13%), Czech ($96,525, a difference of 0.15%), and Ethiopian ($96,824, a difference of 0.16%).
| Demographics | Rating | Rank | Householder Income Ages 25 - 44 years |
| Immigrants | Jordan | 81.0 /100 | #143 | Excellent $97,185 |
| Immigrants | Chile | 80.8 /100 | #144 | Excellent $97,159 |
| Norwegians | 78.2 /100 | #145 | Good $96,866 |
| Ethiopians | 77.8 /100 | #146 | Good $96,824 |
| Immigrants | Syria | 77.4 /100 | #147 | Good $96,789 |
| Irish | 76.9 /100 | #148 | Good $96,730 |
| Basques | 76.6 /100 | #149 | Good $96,709 |
| Ugandans | 76.2 /100 | #150 | Good $96,667 |
| Czechs | 74.8 /100 | #151 | Good $96,525 |
| South American Indians | 74.5 /100 | #152 | Good $96,497 |
| Slovenes | 73.9 /100 | #153 | Good $96,439 |
| Slavs | 73.2 /100 | #154 | Good $96,377 |
| Moroccans | 70.3 /100 | #155 | Good $96,117 |
| Immigrants | Germany | 67.9 /100 | #156 | Good $95,913 |
| Immigrants | Uganda | 65.2 /100 | #157 | Good $95,698 |