Belgian vs Hispanic or Latino Householder Income Over 65 years
COMPARE
Belgian
Hispanic or Latino
Householder Income Over 65 years
Householder Income Over 65 years Comparison
Belgians
Hispanics or Latinos
$59,915
HOUSEHOLDER INCOME OVER 65 YEARS
24.9/ 100
METRIC RATING
191st/ 347
METRIC RANK
$52,832
HOUSEHOLDER INCOME OVER 65 YEARS
0.0/ 100
METRIC RATING
307th/ 347
METRIC RANK
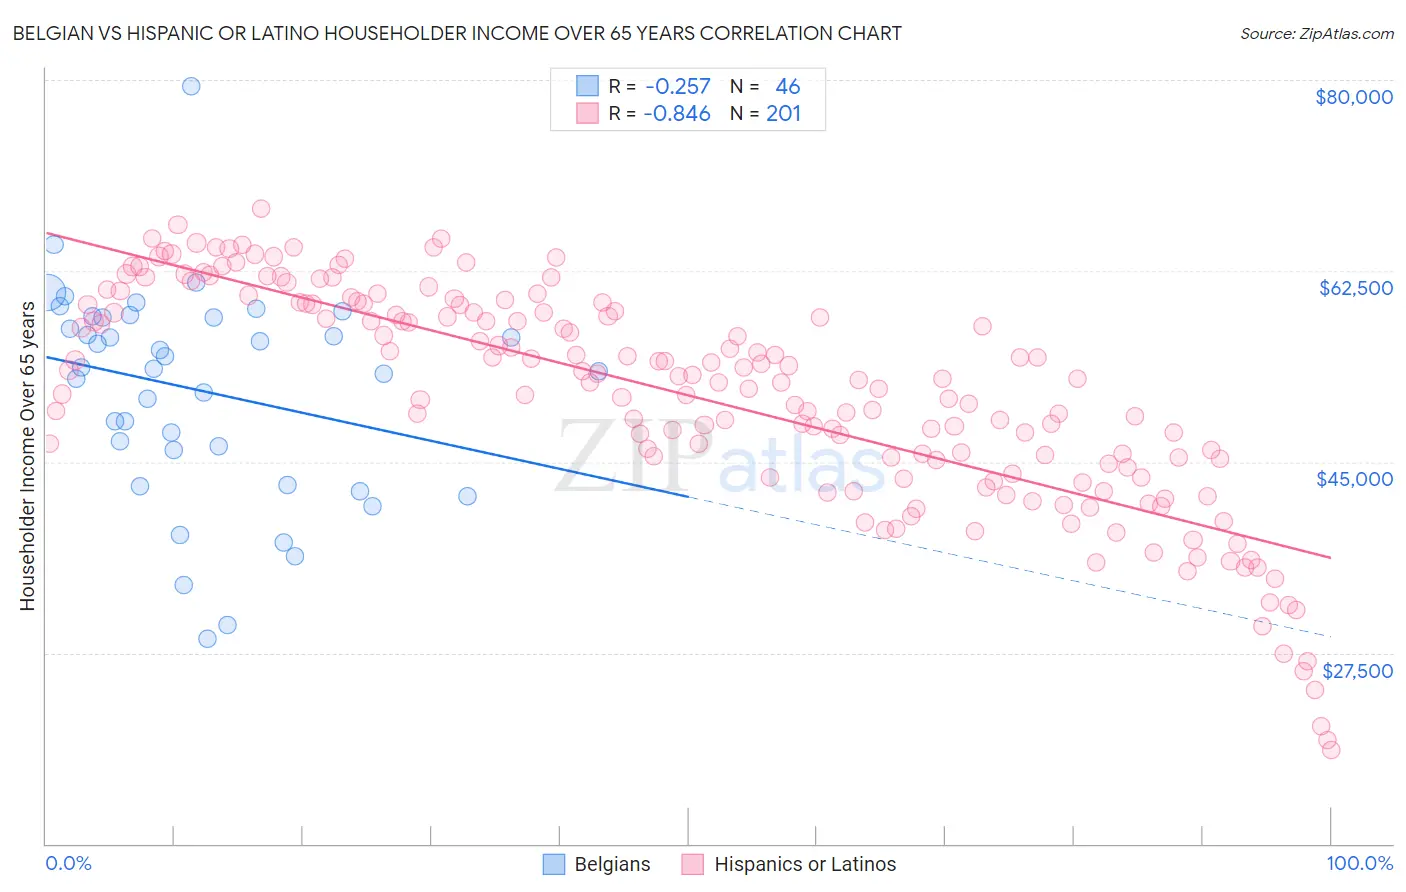
Belgian vs Hispanic or Latino Householder Income Over 65 years Correlation Chart
The statistical analysis conducted on geographies consisting of 355,085,378 people shows a weak negative correlation between the proportion of Belgians and household income with householder over the age of 65 in the United States with a correlation coefficient (R) of -0.257 and weighted average of $59,915. Similarly, the statistical analysis conducted on geographies consisting of 572,369,313 people shows a very strong negative correlation between the proportion of Hispanics or Latinos and household income with householder over the age of 65 in the United States with a correlation coefficient (R) of -0.846 and weighted average of $52,832, a difference of 13.4%.
Householder Income Over 65 years Correlation Summary
| Measurement | Belgian | Hispanic or Latino |
| Minimum | $28,750 | $18,538 |
| Maximum | $79,412 | $68,171 |
| Range | $50,662 | $49,633 |
| Mean | $51,516 | $51,010 |
| Median | $53,553 | $52,570 |
| Interquartile 25% (IQ1) | $46,134 | $44,659 |
| Interquartile 75% (IQ3) | $58,281 | $59,438 |
| Interquartile Range (IQR) | $12,147 | $14,779 |
| Standard Deviation (Sample) | $9,760 | $10,248 |
| Standard Deviation (Population) | $9,654 | $10,222 |
Similar Demographics by Householder Income Over 65 years
Demographics Similar to Belgians by Householder Income Over 65 years
In terms of householder income over 65 years, the demographic groups most similar to Belgians are Puget Sound Salish ($59,934, a difference of 0.030%), South American ($59,854, a difference of 0.10%), Immigrants from Costa Rica ($59,848, a difference of 0.11%), Immigrants from Africa ($59,837, a difference of 0.13%), and Immigrants from Iraq ($59,824, a difference of 0.15%).
| Demographics | Rating | Rank | Householder Income Over 65 years |
| Iraqis | 37.2 /100 | #184 | Fair $60,466 |
| Albanians | 32.0 /100 | #185 | Fair $60,249 |
| Slovenes | 31.8 /100 | #186 | Fair $60,241 |
| Immigrants | Thailand | 31.3 /100 | #187 | Fair $60,217 |
| Immigrants | Eritrea | 28.6 /100 | #188 | Fair $60,096 |
| Ghanaians | 27.5 /100 | #189 | Fair $60,043 |
| Puget Sound Salish | 25.3 /100 | #190 | Fair $59,934 |
| Belgians | 24.9 /100 | #191 | Fair $59,915 |
| South Americans | 23.8 /100 | #192 | Fair $59,854 |
| Immigrants | Costa Rica | 23.6 /100 | #193 | Fair $59,848 |
| Immigrants | Africa | 23.4 /100 | #194 | Fair $59,837 |
| Immigrants | Iraq | 23.2 /100 | #195 | Fair $59,824 |
| Germans | 21.5 /100 | #196 | Fair $59,730 |
| Immigrants | Kenya | 21.1 /100 | #197 | Fair $59,710 |
| Moroccans | 20.7 /100 | #198 | Fair $59,683 |
Demographics Similar to Hispanics or Latinos by Householder Income Over 65 years
In terms of householder income over 65 years, the demographic groups most similar to Hispanics or Latinos are Immigrants from Mexico ($52,801, a difference of 0.060%), Pennsylvania German ($52,888, a difference of 0.11%), Pueblo ($52,930, a difference of 0.19%), Ute ($52,949, a difference of 0.22%), and Honduran ($52,634, a difference of 0.38%).
| Demographics | Rating | Rank | Householder Income Over 65 years |
| Immigrants | Bahamas | 0.0 /100 | #300 | Tragic $53,174 |
| Yuman | 0.0 /100 | #301 | Tragic $53,110 |
| Spanish American Indians | 0.0 /100 | #302 | Tragic $53,077 |
| Choctaw | 0.0 /100 | #303 | Tragic $53,060 |
| Ute | 0.0 /100 | #304 | Tragic $52,949 |
| Pueblo | 0.0 /100 | #305 | Tragic $52,930 |
| Pennsylvania Germans | 0.0 /100 | #306 | Tragic $52,888 |
| Hispanics or Latinos | 0.0 /100 | #307 | Tragic $52,832 |
| Immigrants | Mexico | 0.0 /100 | #308 | Tragic $52,801 |
| Hondurans | 0.0 /100 | #309 | Tragic $52,634 |
| Sioux | 0.0 /100 | #310 | Tragic $52,509 |
| Seminole | 0.0 /100 | #311 | Tragic $52,373 |
| Immigrants | Azores | 0.0 /100 | #312 | Tragic $52,121 |
| Immigrants | Nicaragua | 0.0 /100 | #313 | Tragic $52,085 |
| Natives/Alaskans | 0.0 /100 | #314 | Tragic $52,081 |