Swiss vs Sudanese 9th Grade
COMPARE
Swiss
Sudanese
9th Grade
9th Grade Comparison
Swiss
Sudanese
95.7%
9TH GRADE
99.2/ 100
METRIC RATING
83rd/ 347
METRIC RANK
94.7%
9TH GRADE
32.7/ 100
METRIC RATING
190th/ 347
METRIC RANK
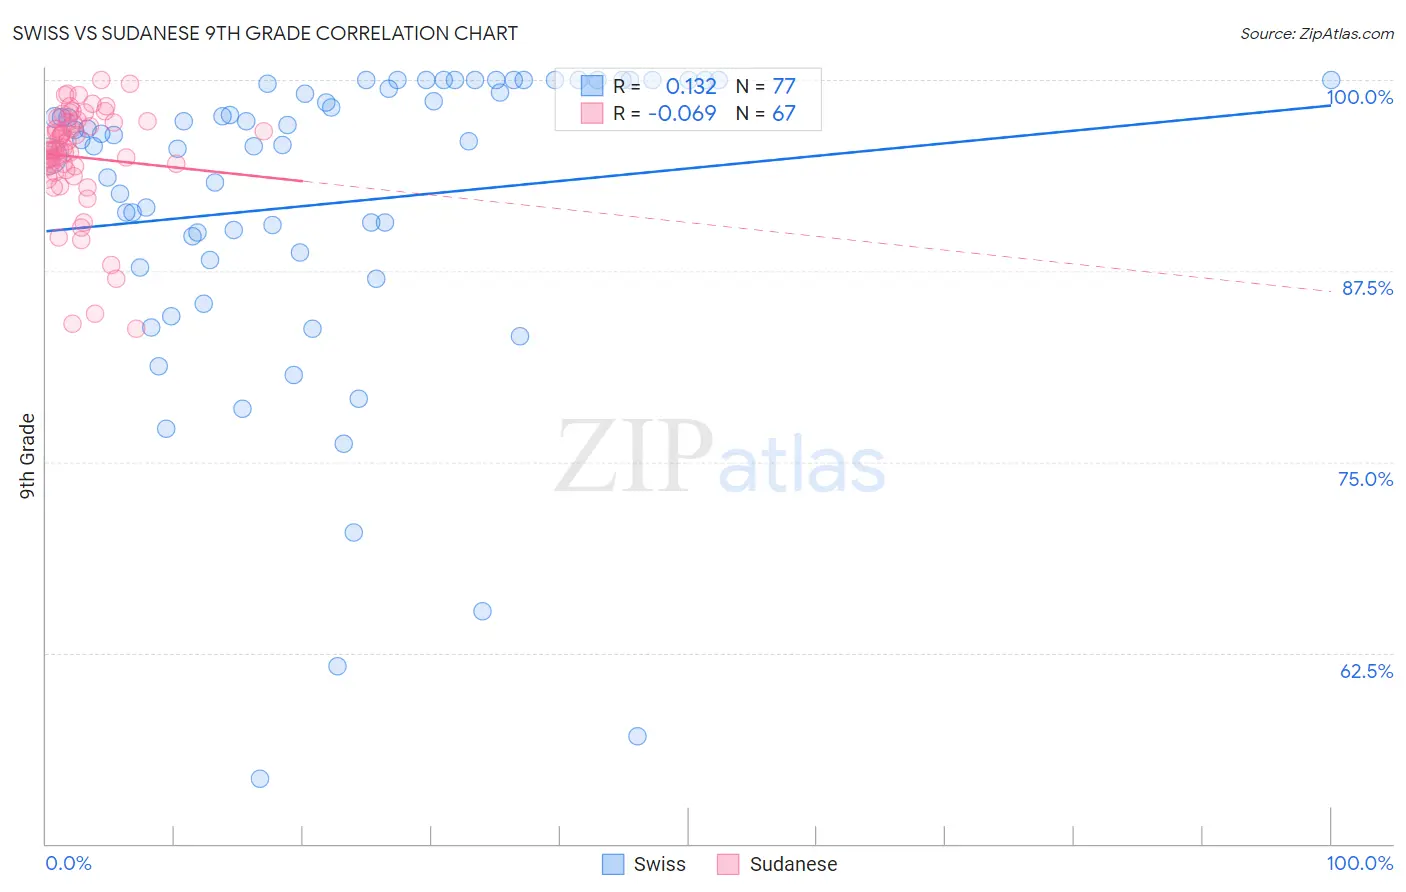
Swiss vs Sudanese 9th Grade Correlation Chart
The statistical analysis conducted on geographies consisting of 465,022,424 people shows a poor positive correlation between the proportion of Swiss and percentage of population with at least 9th grade education in the United States with a correlation coefficient (R) of 0.132 and weighted average of 95.7%. Similarly, the statistical analysis conducted on geographies consisting of 110,134,719 people shows a slight negative correlation between the proportion of Sudanese and percentage of population with at least 9th grade education in the United States with a correlation coefficient (R) of -0.069 and weighted average of 94.7%, a difference of 1.0%.
9th Grade Correlation Summary
| Measurement | Swiss | Sudanese |
| Minimum | 54.2% | 83.7% |
| Maximum | 100.0% | 100.0% |
| Range | 45.8% | 16.3% |
| Mean | 91.9% | 95.0% |
| Median | 96.1% | 95.4% |
| Interquartile 25% (IQ1) | 88.4% | 94.1% |
| Interquartile 75% (IQ3) | 99.9% | 97.2% |
| Interquartile Range (IQR) | 11.4% | 3.1% |
| Standard Deviation (Sample) | 10.4% | 3.5% |
| Standard Deviation (Population) | 10.3% | 3.5% |
Similar Demographics by 9th Grade
Demographics Similar to Swiss by 9th Grade
In terms of 9th grade, the demographic groups most similar to Swiss are Immigrants from Denmark (95.7%, a difference of 0.010%), Icelander (95.7%, a difference of 0.010%), Immigrants from Western Europe (95.7%, a difference of 0.010%), Bhutanese (95.7%, a difference of 0.020%), and Arapaho (95.7%, a difference of 0.020%).
| Demographics | Rating | Rank | 9th Grade |
| Immigrants | Sweden | 99.5 /100 | #76 | Exceptional 95.8% |
| Whites/Caucasians | 99.4 /100 | #77 | Exceptional 95.8% |
| Immigrants | South Africa | 99.4 /100 | #78 | Exceptional 95.8% |
| Romanians | 99.3 /100 | #79 | Exceptional 95.7% |
| Bhutanese | 99.3 /100 | #80 | Exceptional 95.7% |
| Arapaho | 99.3 /100 | #81 | Exceptional 95.7% |
| Puget Sound Salish | 99.2 /100 | #82 | Exceptional 95.7% |
| Swiss | 99.2 /100 | #83 | Exceptional 95.7% |
| Immigrants | Denmark | 99.1 /100 | #84 | Exceptional 95.7% |
| Icelanders | 99.1 /100 | #85 | Exceptional 95.7% |
| Immigrants | Western Europe | 99.1 /100 | #86 | Exceptional 95.7% |
| Okinawans | 99.0 /100 | #87 | Exceptional 95.7% |
| Immigrants | Czechoslovakia | 98.9 /100 | #88 | Exceptional 95.7% |
| Yugoslavians | 98.9 /100 | #89 | Exceptional 95.7% |
| South Africans | 98.8 /100 | #90 | Exceptional 95.6% |
Demographics Similar to Sudanese by 9th Grade
In terms of 9th grade, the demographic groups most similar to Sudanese are Immigrants from Argentina (94.8%, a difference of 0.010%), Assyrian/Chaldean/Syriac (94.7%, a difference of 0.010%), Guamanian/Chamorro (94.8%, a difference of 0.020%), Immigrants from Albania (94.8%, a difference of 0.020%), and Immigrants from Northern Africa (94.7%, a difference of 0.020%).
| Demographics | Rating | Rank | 9th Grade |
| Immigrants | Nepal | 39.7 /100 | #183 | Fair 94.8% |
| Argentineans | 37.6 /100 | #184 | Fair 94.8% |
| Liberians | 37.4 /100 | #185 | Fair 94.8% |
| Hopi | 37.1 /100 | #186 | Fair 94.8% |
| Guamanians/Chamorros | 35.5 /100 | #187 | Fair 94.8% |
| Immigrants | Albania | 34.5 /100 | #188 | Fair 94.8% |
| Immigrants | Argentina | 34.4 /100 | #189 | Fair 94.8% |
| Sudanese | 32.7 /100 | #190 | Fair 94.7% |
| Assyrians/Chaldeans/Syriacs | 32.0 /100 | #191 | Fair 94.7% |
| Immigrants | Northern Africa | 30.7 /100 | #192 | Fair 94.7% |
| Paraguayans | 30.1 /100 | #193 | Fair 94.7% |
| Panamanians | 29.0 /100 | #194 | Fair 94.7% |
| Marshallese | 27.9 /100 | #195 | Fair 94.7% |
| Immigrants | Lebanon | 27.2 /100 | #196 | Fair 94.7% |
| Immigrants | Micronesia | 24.7 /100 | #197 | Fair 94.7% |