Swiss vs Immigrants from Belize Median Earnings
COMPARE
Swiss
Immigrants from Belize
Median Earnings
Median Earnings Comparison
Swiss
Immigrants from Belize
$46,315
MEDIAN EARNINGS
45.9/ 100
METRIC RATING
182nd/ 347
METRIC RANK
$42,339
MEDIAN EARNINGS
0.3/ 100
METRIC RATING
275th/ 347
METRIC RANK
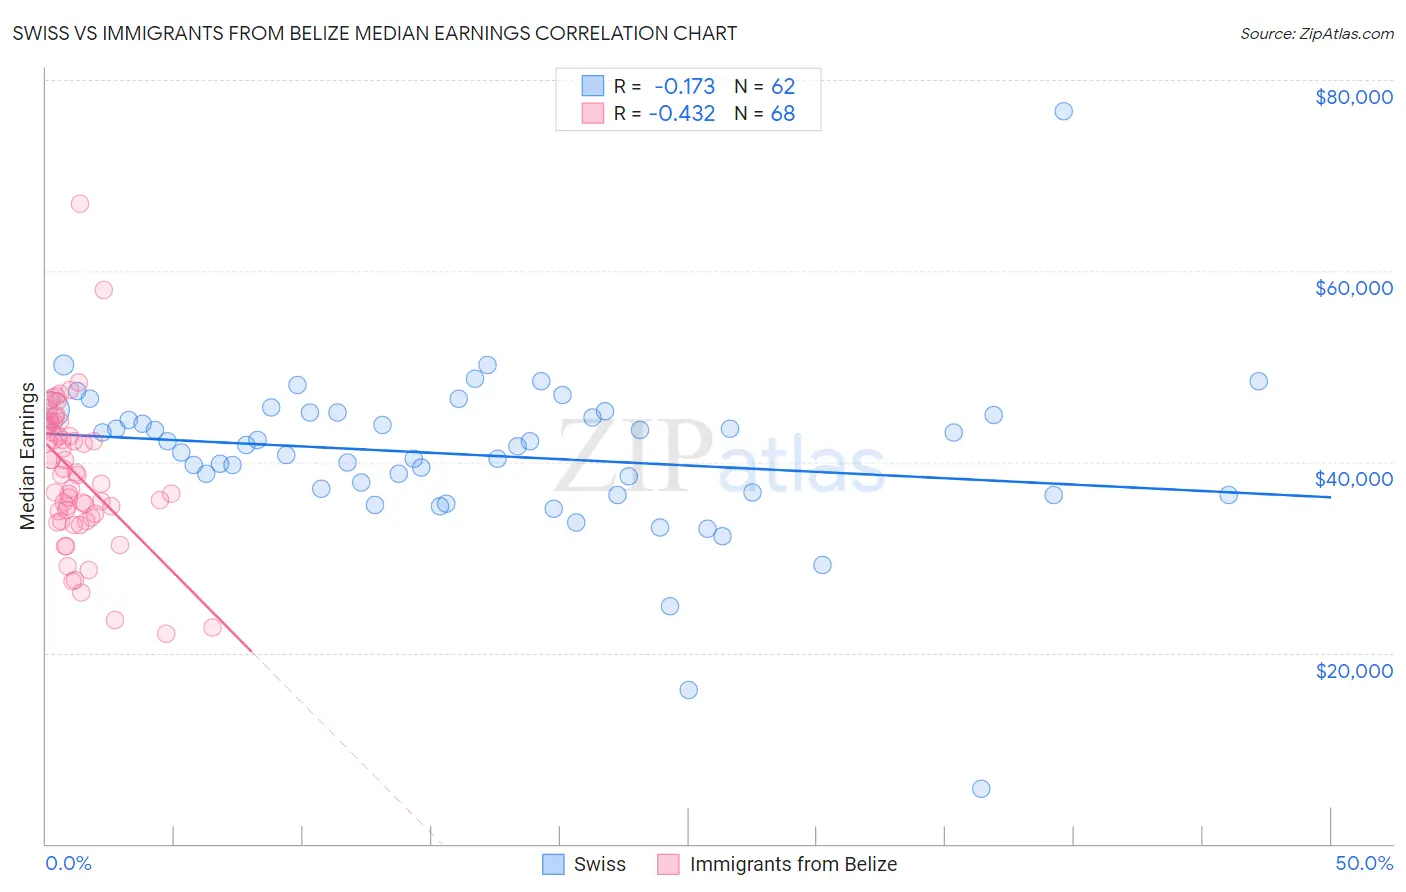
Swiss vs Immigrants from Belize Median Earnings Correlation Chart
The statistical analysis conducted on geographies consisting of 464,919,245 people shows a poor negative correlation between the proportion of Swiss and median earnings in the United States with a correlation coefficient (R) of -0.173 and weighted average of $46,315. Similarly, the statistical analysis conducted on geographies consisting of 130,311,555 people shows a moderate negative correlation between the proportion of Immigrants from Belize and median earnings in the United States with a correlation coefficient (R) of -0.432 and weighted average of $42,339, a difference of 9.4%.
Median Earnings Correlation Summary
| Measurement | Swiss | Immigrants from Belize |
| Minimum | $5,729 | $22,042 |
| Maximum | $76,771 | $66,975 |
| Range | $71,042 | $44,933 |
| Mean | $40,710 | $38,697 |
| Median | $41,698 | $38,598 |
| Interquartile 25% (IQ1) | $36,797 | $34,404 |
| Interquartile 75% (IQ3) | $45,132 | $43,711 |
| Interquartile Range (IQR) | $8,335 | $9,306 |
| Standard Deviation (Sample) | $8,837 | $7,646 |
| Standard Deviation (Population) | $8,765 | $7,590 |
Similar Demographics by Median Earnings
Demographics Similar to Swiss by Median Earnings
In terms of median earnings, the demographic groups most similar to Swiss are Immigrants from Cameroon ($46,329, a difference of 0.030%), English ($46,334, a difference of 0.040%), Puget Sound Salish ($46,333, a difference of 0.040%), French ($46,296, a difference of 0.040%), and Colombian ($46,349, a difference of 0.070%).
| Demographics | Rating | Rank | Median Earnings |
| Basques | 48.8 /100 | #175 | Average $46,399 |
| Danes | 48.6 /100 | #176 | Average $46,392 |
| Belgians | 48.0 /100 | #177 | Average $46,375 |
| Colombians | 47.1 /100 | #178 | Average $46,349 |
| English | 46.5 /100 | #179 | Average $46,334 |
| Puget Sound Salish | 46.5 /100 | #180 | Average $46,333 |
| Immigrants | Cameroon | 46.4 /100 | #181 | Average $46,329 |
| Swiss | 45.9 /100 | #182 | Average $46,315 |
| French | 45.2 /100 | #183 | Average $46,296 |
| Immigrants | Kenya | 42.4 /100 | #184 | Average $46,214 |
| Uruguayans | 41.6 /100 | #185 | Average $46,190 |
| Vietnamese | 40.9 /100 | #186 | Average $46,172 |
| Iraqis | 39.9 /100 | #187 | Fair $46,140 |
| Immigrants | Armenia | 38.3 /100 | #188 | Fair $46,094 |
| Spaniards | 37.2 /100 | #189 | Fair $46,059 |
Demographics Similar to Immigrants from Belize by Median Earnings
In terms of median earnings, the demographic groups most similar to Immigrants from Belize are Spanish American ($42,316, a difference of 0.060%), Central American ($42,280, a difference of 0.14%), Immigrants from El Salvador ($42,413, a difference of 0.18%), Immigrants from Dominica ($42,420, a difference of 0.19%), and Iroquois ($42,430, a difference of 0.22%).
| Demographics | Rating | Rank | Median Earnings |
| Americans | 0.6 /100 | #268 | Tragic $42,742 |
| Belizeans | 0.5 /100 | #269 | Tragic $42,702 |
| Osage | 0.5 /100 | #270 | Tragic $42,651 |
| Pennsylvania Germans | 0.5 /100 | #271 | Tragic $42,615 |
| Iroquois | 0.4 /100 | #272 | Tragic $42,430 |
| Immigrants | Dominica | 0.4 /100 | #273 | Tragic $42,420 |
| Immigrants | El Salvador | 0.4 /100 | #274 | Tragic $42,413 |
| Immigrants | Belize | 0.3 /100 | #275 | Tragic $42,339 |
| Spanish Americans | 0.3 /100 | #276 | Tragic $42,316 |
| Central Americans | 0.3 /100 | #277 | Tragic $42,280 |
| Cajuns | 0.3 /100 | #278 | Tragic $42,189 |
| Colville | 0.2 /100 | #279 | Tragic $42,151 |
| Hmong | 0.2 /100 | #280 | Tragic $42,111 |
| Marshallese | 0.2 /100 | #281 | Tragic $41,969 |
| Africans | 0.2 /100 | #282 | Tragic $41,955 |