Swiss vs Immigrants from Belize Seniors Poverty Over the Age of 65
COMPARE
Swiss
Immigrants from Belize
Seniors Poverty Over the Age of 65
Seniors Poverty Over the Age of 65 Comparison
Swiss
Immigrants from Belize
9.2%
SENIORS POVERTY OVER THE AGE OF 65
99.9/ 100
METRIC RATING
19th/ 347
METRIC RANK
14.0%
SENIORS POVERTY OVER THE AGE OF 65
0.0/ 100
METRIC RATING
298th/ 347
METRIC RANK
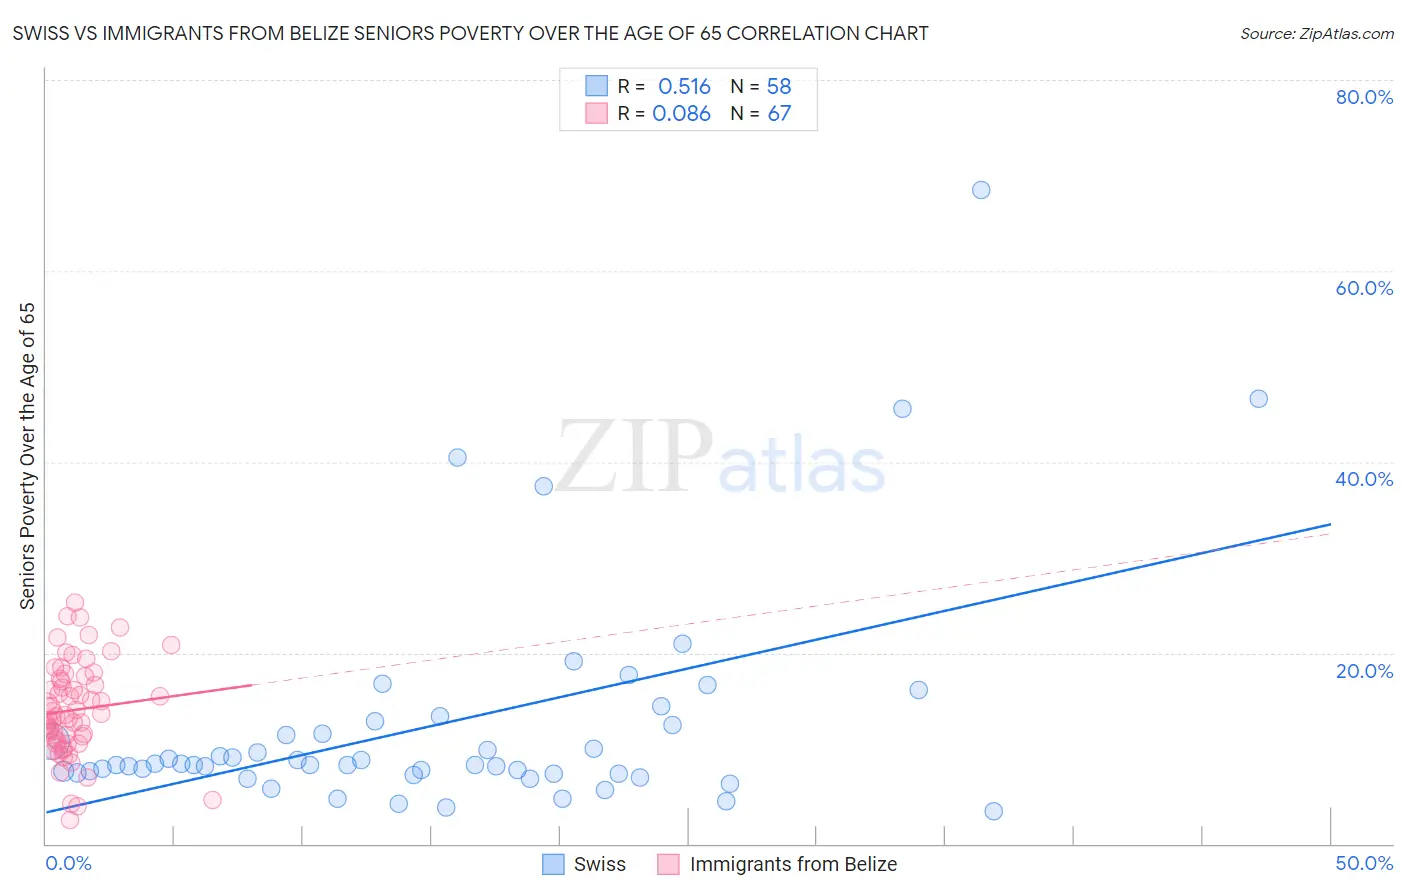
Swiss vs Immigrants from Belize Seniors Poverty Over the Age of 65 Correlation Chart
The statistical analysis conducted on geographies consisting of 462,823,104 people shows a substantial positive correlation between the proportion of Swiss and poverty level among seniors over the age of 65 in the United States with a correlation coefficient (R) of 0.516 and weighted average of 9.2%. Similarly, the statistical analysis conducted on geographies consisting of 130,248,265 people shows a slight positive correlation between the proportion of Immigrants from Belize and poverty level among seniors over the age of 65 in the United States with a correlation coefficient (R) of 0.086 and weighted average of 14.0%, a difference of 52.0%.
Seniors Poverty Over the Age of 65 Correlation Summary
| Measurement | Swiss | Immigrants from Belize |
| Minimum | 3.4% | 2.5% |
| Maximum | 68.4% | 25.3% |
| Range | 65.1% | 22.8% |
| Mean | 12.6% | 14.0% |
| Median | 8.3% | 13.4% |
| Interquartile 25% (IQ1) | 7.4% | 10.8% |
| Interquartile 75% (IQ3) | 12.5% | 17.3% |
| Interquartile Range (IQR) | 5.1% | 6.6% |
| Standard Deviation (Sample) | 12.0% | 4.9% |
| Standard Deviation (Population) | 11.9% | 4.9% |
Similar Demographics by Seniors Poverty Over the Age of 65
Demographics Similar to Swiss by Seniors Poverty Over the Age of 65
In terms of seniors poverty over the age of 65, the demographic groups most similar to Swiss are Thai (9.2%, a difference of 0.14%), Slovak (9.2%, a difference of 0.29%), Scottish (9.2%, a difference of 0.32%), European (9.2%, a difference of 0.43%), and Luxembourger (9.2%, a difference of 0.43%).
| Demographics | Rating | Rank | Seniors Poverty Over the Age of 65 |
| Scandinavians | 99.9 /100 | #12 | Exceptional 9.1% |
| Croatians | 99.9 /100 | #13 | Exceptional 9.1% |
| Poles | 99.9 /100 | #14 | Exceptional 9.1% |
| Dutch | 99.9 /100 | #15 | Exceptional 9.1% |
| Europeans | 99.9 /100 | #16 | Exceptional 9.2% |
| Scottish | 99.9 /100 | #17 | Exceptional 9.2% |
| Slovaks | 99.9 /100 | #18 | Exceptional 9.2% |
| Swiss | 99.9 /100 | #19 | Exceptional 9.2% |
| Thais | 99.9 /100 | #20 | Exceptional 9.2% |
| Luxembourgers | 99.9 /100 | #21 | Exceptional 9.2% |
| Slovenes | 99.9 /100 | #22 | Exceptional 9.3% |
| Welsh | 99.9 /100 | #23 | Exceptional 9.3% |
| Bulgarians | 99.9 /100 | #24 | Exceptional 9.3% |
| Irish | 99.9 /100 | #25 | Exceptional 9.3% |
| Immigrants | Scotland | 99.9 /100 | #26 | Exceptional 9.3% |
Demographics Similar to Immigrants from Belize by Seniors Poverty Over the Age of 65
In terms of seniors poverty over the age of 65, the demographic groups most similar to Immigrants from Belize are Ecuadorian (14.0%, a difference of 0.070%), Immigrants from Uzbekistan (14.0%, a difference of 0.15%), Vietnamese (14.0%, a difference of 0.28%), Immigrants from Jamaica (13.9%, a difference of 0.36%), and U.S. Virgin Islander (14.0%, a difference of 0.36%).
| Demographics | Rating | Rank | Seniors Poverty Over the Age of 65 |
| Blacks/African Americans | 0.0 /100 | #291 | Tragic 13.7% |
| Spanish American Indians | 0.0 /100 | #292 | Tragic 13.8% |
| Immigrants | Guatemala | 0.0 /100 | #293 | Tragic 13.8% |
| Cheyenne | 0.0 /100 | #294 | Tragic 13.9% |
| Apache | 0.0 /100 | #295 | Tragic 13.9% |
| Immigrants | Jamaica | 0.0 /100 | #296 | Tragic 13.9% |
| Vietnamese | 0.0 /100 | #297 | Tragic 14.0% |
| Immigrants | Belize | 0.0 /100 | #298 | Tragic 14.0% |
| Ecuadorians | 0.0 /100 | #299 | Tragic 14.0% |
| Immigrants | Uzbekistan | 0.0 /100 | #300 | Tragic 14.0% |
| U.S. Virgin Islanders | 0.0 /100 | #301 | Tragic 14.0% |
| Yup'ik | 0.0 /100 | #302 | Tragic 14.1% |
| Immigrants | Bangladesh | 0.0 /100 | #303 | Tragic 14.1% |
| West Indians | 0.0 /100 | #304 | Tragic 14.1% |
| Immigrants | Trinidad and Tobago | 0.0 /100 | #305 | Tragic 14.1% |