Swiss vs Immigrants from Belize Unemployment Among Ages 16 to 19 years
COMPARE
Swiss
Immigrants from Belize
Unemployment Among Ages 16 to 19 years
Unemployment Among Ages 16 to 19 years Comparison
Swiss
Immigrants from Belize
15.8%
UNEMPLOYMENT AMONG AGES 16 TO 19 YEARS
100.0/ 100
METRIC RATING
19th/ 347
METRIC RANK
22.2%
UNEMPLOYMENT AMONG AGES 16 TO 19 YEARS
0.0/ 100
METRIC RATING
317th/ 347
METRIC RANK
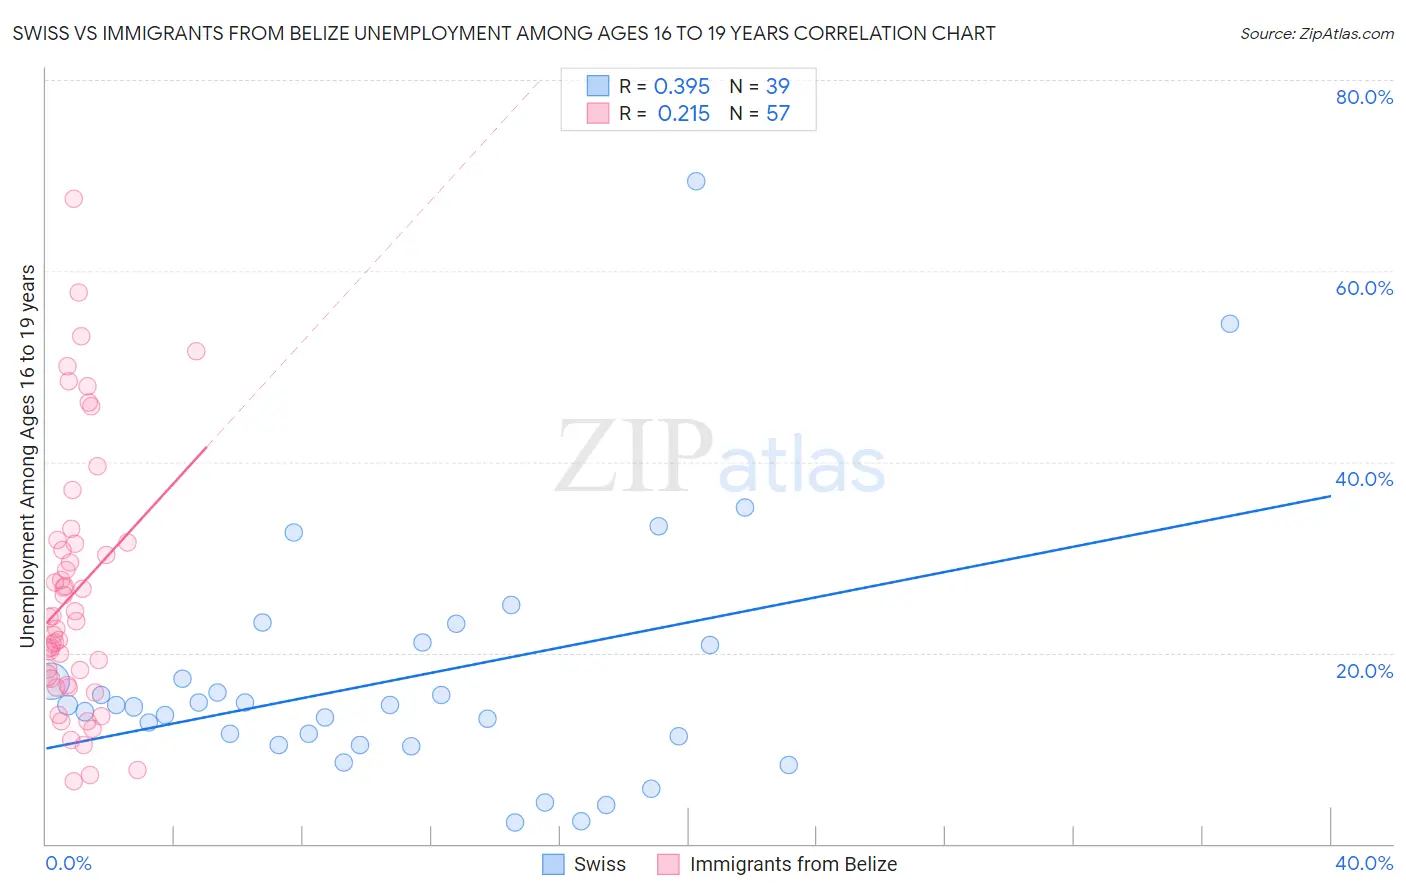
Swiss vs Immigrants from Belize Unemployment Among Ages 16 to 19 years Correlation Chart
The statistical analysis conducted on geographies consisting of 429,339,999 people shows a mild positive correlation between the proportion of Swiss and unemployment rate among population between the ages 16 and 19 in the United States with a correlation coefficient (R) of 0.395 and weighted average of 15.8%. Similarly, the statistical analysis conducted on geographies consisting of 128,436,960 people shows a weak positive correlation between the proportion of Immigrants from Belize and unemployment rate among population between the ages 16 and 19 in the United States with a correlation coefficient (R) of 0.215 and weighted average of 22.2%, a difference of 40.6%.
Unemployment Among Ages 16 to 19 years Correlation Summary
| Measurement | Swiss | Immigrants from Belize |
| Minimum | 2.2% | 6.5% |
| Maximum | 69.4% | 67.6% |
| Range | 67.2% | 61.1% |
| Mean | 17.3% | 26.3% |
| Median | 14.5% | 23.3% |
| Interquartile 25% (IQ1) | 10.3% | 17.0% |
| Interquartile 75% (IQ3) | 20.8% | 31.5% |
| Interquartile Range (IQR) | 10.5% | 14.5% |
| Standard Deviation (Sample) | 13.1% | 13.6% |
| Standard Deviation (Population) | 12.9% | 13.5% |
Similar Demographics by Unemployment Among Ages 16 to 19 years
Demographics Similar to Swiss by Unemployment Among Ages 16 to 19 years
In terms of unemployment among ages 16 to 19 years, the demographic groups most similar to Swiss are Sudanese (15.8%, a difference of 0.10%), Thai (15.7%, a difference of 0.11%), Somali (15.7%, a difference of 0.35%), Immigrants from Taiwan (15.8%, a difference of 0.42%), and German (15.7%, a difference of 0.56%).
| Demographics | Rating | Rank | Unemployment Among Ages 16 to 19 years |
| Taiwanese | 100.0 /100 | #12 | Exceptional 15.5% |
| Immigrants | Burma/Myanmar | 100.0 /100 | #13 | Exceptional 15.6% |
| Immigrants | Zaire | 100.0 /100 | #14 | Exceptional 15.6% |
| Yugoslavians | 100.0 /100 | #15 | Exceptional 15.6% |
| Germans | 100.0 /100 | #16 | Exceptional 15.7% |
| Somalis | 100.0 /100 | #17 | Exceptional 15.7% |
| Thais | 100.0 /100 | #18 | Exceptional 15.7% |
| Swiss | 100.0 /100 | #19 | Exceptional 15.8% |
| Sudanese | 100.0 /100 | #20 | Exceptional 15.8% |
| Immigrants | Taiwan | 100.0 /100 | #21 | Exceptional 15.8% |
| Finns | 100.0 /100 | #22 | Exceptional 15.9% |
| Belgians | 100.0 /100 | #23 | Exceptional 15.9% |
| Tongans | 100.0 /100 | #24 | Exceptional 15.9% |
| Filipinos | 100.0 /100 | #25 | Exceptional 15.9% |
| Dutch | 100.0 /100 | #26 | Exceptional 15.9% |
Demographics Similar to Immigrants from Belize by Unemployment Among Ages 16 to 19 years
In terms of unemployment among ages 16 to 19 years, the demographic groups most similar to Immigrants from Belize are Immigrants from Jamaica (22.2%, a difference of 0.15%), Immigrants from West Indies (22.2%, a difference of 0.31%), Tohono O'odham (22.1%, a difference of 0.45%), Cheyenne (22.3%, a difference of 0.54%), and Immigrants from Dominica (21.9%, a difference of 0.99%).
| Demographics | Rating | Rank | Unemployment Among Ages 16 to 19 years |
| Vietnamese | 0.0 /100 | #310 | Tragic 21.5% |
| Belizeans | 0.0 /100 | #311 | Tragic 21.6% |
| Houma | 0.0 /100 | #312 | Tragic 21.6% |
| Jamaicans | 0.0 /100 | #313 | Tragic 21.7% |
| Alaska Natives | 0.0 /100 | #314 | Tragic 21.8% |
| Immigrants | Dominica | 0.0 /100 | #315 | Tragic 21.9% |
| Tohono O'odham | 0.0 /100 | #316 | Tragic 22.1% |
| Immigrants | Belize | 0.0 /100 | #317 | Tragic 22.2% |
| Immigrants | Jamaica | 0.0 /100 | #318 | Tragic 22.2% |
| Immigrants | West Indies | 0.0 /100 | #319 | Tragic 22.2% |
| Cheyenne | 0.0 /100 | #320 | Tragic 22.3% |
| West Indians | 0.0 /100 | #321 | Tragic 22.4% |
| Barbadians | 0.0 /100 | #322 | Tragic 22.5% |
| Yakama | 0.0 /100 | #323 | Tragic 22.5% |
| Immigrants | Armenia | 0.0 /100 | #324 | Tragic 22.6% |