Immigrants from Lebanon vs Immigrants from Belize Median Earnings
COMPARE
Immigrants from Lebanon
Immigrants from Belize
Median Earnings
Median Earnings Comparison
Immigrants from Lebanon
Immigrants from Belize
$49,682
MEDIAN EARNINGS
99.0/ 100
METRIC RATING
96th/ 347
METRIC RANK
$42,339
MEDIAN EARNINGS
0.3/ 100
METRIC RATING
275th/ 347
METRIC RANK
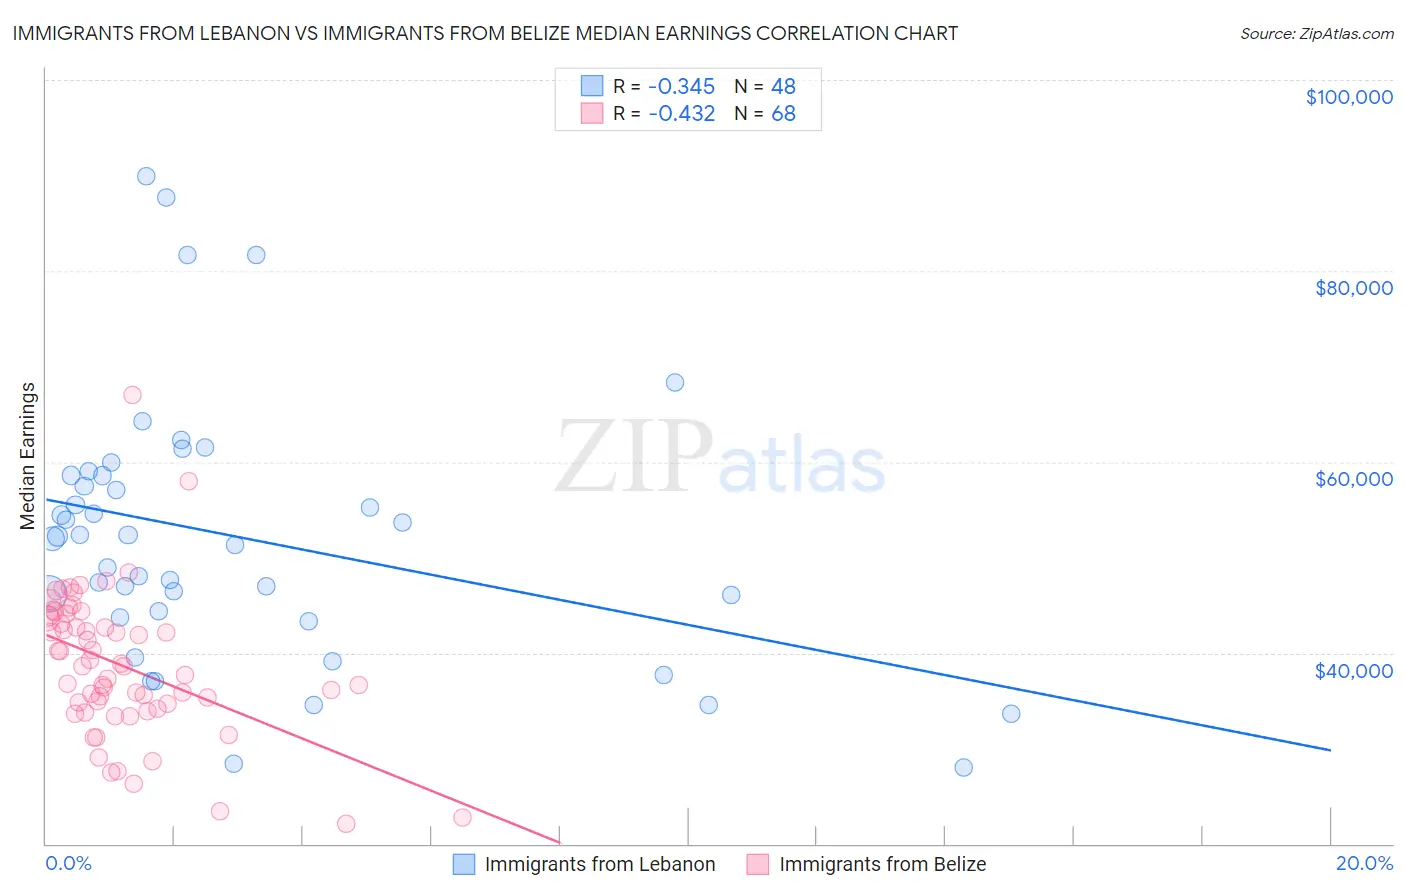
Immigrants from Lebanon vs Immigrants from Belize Median Earnings Correlation Chart
The statistical analysis conducted on geographies consisting of 217,150,005 people shows a mild negative correlation between the proportion of Immigrants from Lebanon and median earnings in the United States with a correlation coefficient (R) of -0.345 and weighted average of $49,682. Similarly, the statistical analysis conducted on geographies consisting of 130,311,555 people shows a moderate negative correlation between the proportion of Immigrants from Belize and median earnings in the United States with a correlation coefficient (R) of -0.432 and weighted average of $42,339, a difference of 17.3%.
Median Earnings Correlation Summary
| Measurement | Immigrants from Lebanon | Immigrants from Belize |
| Minimum | $27,932 | $22,042 |
| Maximum | $89,953 | $66,975 |
| Range | $62,021 | $44,933 |
| Mean | $52,128 | $38,697 |
| Median | $52,076 | $38,598 |
| Interquartile 25% (IQ1) | $44,033 | $34,404 |
| Interquartile 75% (IQ3) | $58,565 | $43,711 |
| Interquartile Range (IQR) | $14,532 | $9,306 |
| Standard Deviation (Sample) | $13,798 | $7,646 |
| Standard Deviation (Population) | $13,653 | $7,590 |
Similar Demographics by Median Earnings
Demographics Similar to Immigrants from Lebanon by Median Earnings
In terms of median earnings, the demographic groups most similar to Immigrants from Lebanon are Immigrants from North Macedonia ($49,658, a difference of 0.050%), Immigrants from Northern Africa ($49,648, a difference of 0.070%), Immigrants from Afghanistan ($49,645, a difference of 0.070%), Immigrants from England ($49,722, a difference of 0.080%), and Croatian ($49,724, a difference of 0.090%).
| Demographics | Rating | Rank | Median Earnings |
| Immigrants | North America | 99.4 /100 | #89 | Exceptional $50,108 |
| Italians | 99.3 /100 | #90 | Exceptional $49,915 |
| Macedonians | 99.2 /100 | #91 | Exceptional $49,893 |
| Immigrants | Argentina | 99.2 /100 | #92 | Exceptional $49,841 |
| Armenians | 99.1 /100 | #93 | Exceptional $49,804 |
| Croatians | 99.0 /100 | #94 | Exceptional $49,724 |
| Immigrants | England | 99.0 /100 | #95 | Exceptional $49,722 |
| Immigrants | Lebanon | 99.0 /100 | #96 | Exceptional $49,682 |
| Immigrants | North Macedonia | 98.9 /100 | #97 | Exceptional $49,658 |
| Immigrants | Northern Africa | 98.9 /100 | #98 | Exceptional $49,648 |
| Immigrants | Afghanistan | 98.9 /100 | #99 | Exceptional $49,645 |
| Immigrants | Poland | 98.9 /100 | #100 | Exceptional $49,633 |
| Jordanians | 98.9 /100 | #101 | Exceptional $49,632 |
| Ethiopians | 98.8 /100 | #102 | Exceptional $49,572 |
| Austrians | 98.7 /100 | #103 | Exceptional $49,501 |
Demographics Similar to Immigrants from Belize by Median Earnings
In terms of median earnings, the demographic groups most similar to Immigrants from Belize are Spanish American ($42,316, a difference of 0.060%), Central American ($42,280, a difference of 0.14%), Immigrants from El Salvador ($42,413, a difference of 0.18%), Immigrants from Dominica ($42,420, a difference of 0.19%), and Iroquois ($42,430, a difference of 0.22%).
| Demographics | Rating | Rank | Median Earnings |
| Americans | 0.6 /100 | #268 | Tragic $42,742 |
| Belizeans | 0.5 /100 | #269 | Tragic $42,702 |
| Osage | 0.5 /100 | #270 | Tragic $42,651 |
| Pennsylvania Germans | 0.5 /100 | #271 | Tragic $42,615 |
| Iroquois | 0.4 /100 | #272 | Tragic $42,430 |
| Immigrants | Dominica | 0.4 /100 | #273 | Tragic $42,420 |
| Immigrants | El Salvador | 0.4 /100 | #274 | Tragic $42,413 |
| Immigrants | Belize | 0.3 /100 | #275 | Tragic $42,339 |
| Spanish Americans | 0.3 /100 | #276 | Tragic $42,316 |
| Central Americans | 0.3 /100 | #277 | Tragic $42,280 |
| Cajuns | 0.3 /100 | #278 | Tragic $42,189 |
| Colville | 0.2 /100 | #279 | Tragic $42,151 |
| Hmong | 0.2 /100 | #280 | Tragic $42,111 |
| Marshallese | 0.2 /100 | #281 | Tragic $41,969 |
| Africans | 0.2 /100 | #282 | Tragic $41,955 |