Korean vs Immigrants from Austria Householder Income Ages 25 - 44 years
COMPARE
Korean
Immigrants from Austria
Householder Income Ages 25 - 44 years
Householder Income Ages 25 - 44 years Comparison
Koreans
Immigrants from Austria
$103,824
HOUSEHOLDER INCOME AGES 25 - 44 YEARS
99.4/ 100
METRIC RATING
75th/ 347
METRIC RANK
$106,103
HOUSEHOLDER INCOME AGES 25 - 44 YEARS
99.8/ 100
METRIC RATING
57th/ 347
METRIC RANK
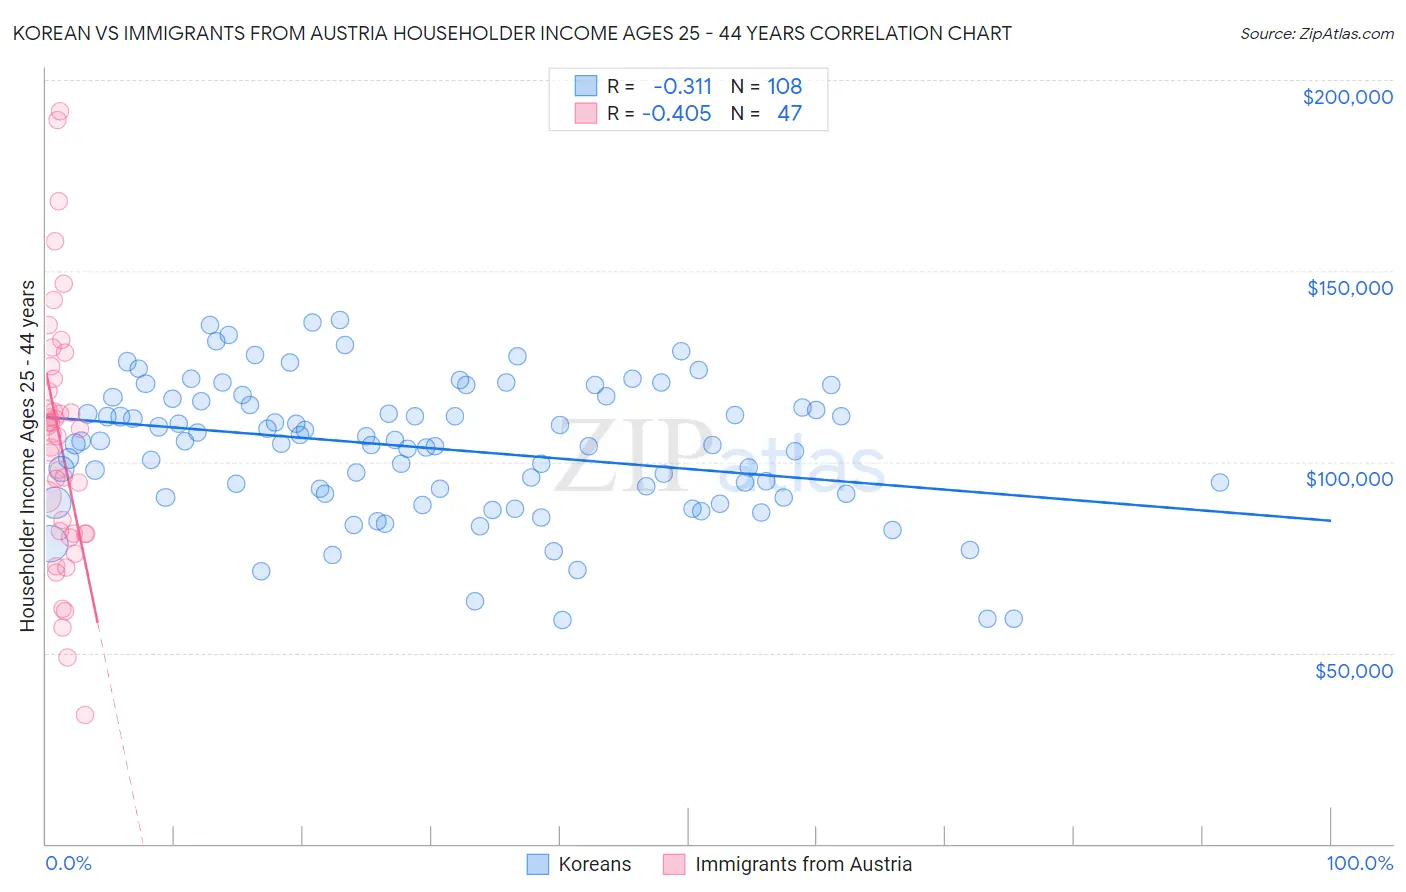
Korean vs Immigrants from Austria Householder Income Ages 25 - 44 years Correlation Chart
The statistical analysis conducted on geographies consisting of 508,598,360 people shows a mild negative correlation between the proportion of Koreans and household income with householder between the ages 25 and 44 in the United States with a correlation coefficient (R) of -0.311 and weighted average of $103,824. Similarly, the statistical analysis conducted on geographies consisting of 167,639,704 people shows a moderate negative correlation between the proportion of Immigrants from Austria and household income with householder between the ages 25 and 44 in the United States with a correlation coefficient (R) of -0.405 and weighted average of $106,103, a difference of 2.2%.
Householder Income Ages 25 - 44 years Correlation Summary
| Measurement | Korean | Immigrants from Austria |
| Minimum | $58,683 | $33,571 |
| Maximum | $137,023 | $191,842 |
| Range | $78,340 | $158,271 |
| Mean | $103,567 | $105,149 |
| Median | $105,054 | $107,519 |
| Interquartile 25% (IQ1) | $91,700 | $81,250 |
| Interquartile 75% (IQ3) | $116,277 | $121,802 |
| Interquartile Range (IQR) | $24,577 | $40,552 |
| Standard Deviation (Sample) | $17,535 | $33,347 |
| Standard Deviation (Population) | $17,454 | $32,991 |
Demographics Similar to Koreans and Immigrants from Austria by Householder Income Ages 25 - 44 years
In terms of householder income ages 25 - 44 years, the demographic groups most similar to Koreans are Immigrants from Spain ($103,752, a difference of 0.070%), Immigrants from Fiji ($103,954, a difference of 0.13%), Italian ($104,215, a difference of 0.38%), Chinese ($104,264, a difference of 0.42%), and Afghan ($104,410, a difference of 0.56%). Similarly, the demographic groups most similar to Immigrants from Austria are Immigrants from Pakistan ($106,129, a difference of 0.030%), Immigrants from South Africa ($105,748, a difference of 0.34%), Immigrants from Latvia ($105,522, a difference of 0.55%), Egyptian ($105,282, a difference of 0.78%), and Lithuanian ($105,223, a difference of 0.84%).
| Demographics | Rating | Rank | Householder Income Ages 25 - 44 years |
| Immigrants | Pakistan | 99.8 /100 | #56 | Exceptional $106,129 |
| Immigrants | Austria | 99.8 /100 | #57 | Exceptional $106,103 |
| Immigrants | South Africa | 99.8 /100 | #58 | Exceptional $105,748 |
| Immigrants | Latvia | 99.8 /100 | #59 | Exceptional $105,522 |
| Egyptians | 99.7 /100 | #60 | Exceptional $105,282 |
| Lithuanians | 99.7 /100 | #61 | Exceptional $105,223 |
| Immigrants | Italy | 99.7 /100 | #62 | Exceptional $105,201 |
| Immigrants | Scotland | 99.7 /100 | #63 | Exceptional $105,089 |
| New Zealanders | 99.7 /100 | #64 | Exceptional $105,085 |
| Immigrants | Netherlands | 99.7 /100 | #65 | Exceptional $105,082 |
| Laotians | 99.7 /100 | #66 | Exceptional $104,993 |
| Immigrants | Romania | 99.6 /100 | #67 | Exceptional $104,713 |
| Immigrants | Eastern Europe | 99.6 /100 | #68 | Exceptional $104,662 |
| Mongolians | 99.6 /100 | #69 | Exceptional $104,578 |
| Immigrants | Croatia | 99.6 /100 | #70 | Exceptional $104,503 |
| Afghans | 99.6 /100 | #71 | Exceptional $104,410 |
| Chinese | 99.5 /100 | #72 | Exceptional $104,264 |
| Italians | 99.5 /100 | #73 | Exceptional $104,215 |
| Immigrants | Fiji | 99.5 /100 | #74 | Exceptional $103,954 |
| Koreans | 99.4 /100 | #75 | Exceptional $103,824 |
| Immigrants | Spain | 99.4 /100 | #76 | Exceptional $103,752 |