Swiss vs Crow Householder Income Ages 25 - 44 years
COMPARE
Swiss
Crow
Householder Income Ages 25 - 44 years
Householder Income Ages 25 - 44 years Comparison
Swiss
Crow
$95,511
HOUSEHOLDER INCOME AGES 25 - 44 YEARS
62.8/ 100
METRIC RATING
162nd/ 347
METRIC RANK
$71,337
HOUSEHOLDER INCOME AGES 25 - 44 YEARS
0.0/ 100
METRIC RATING
342nd/ 347
METRIC RANK
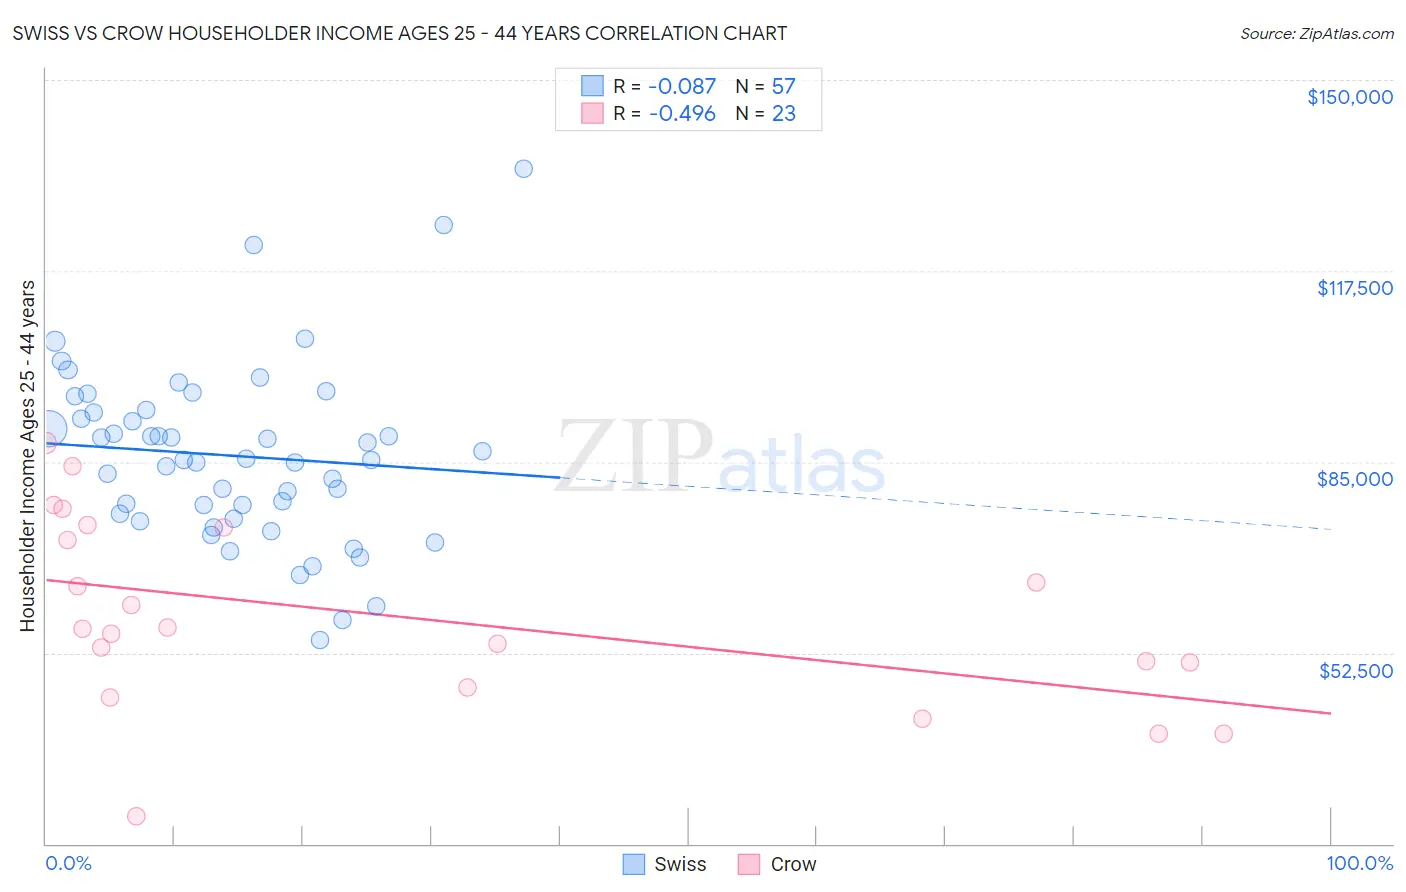
Swiss vs Crow Householder Income Ages 25 - 44 years Correlation Chart
The statistical analysis conducted on geographies consisting of 463,021,921 people shows a slight negative correlation between the proportion of Swiss and household income with householder between the ages 25 and 44 in the United States with a correlation coefficient (R) of -0.087 and weighted average of $95,511. Similarly, the statistical analysis conducted on geographies consisting of 59,146,182 people shows a moderate negative correlation between the proportion of Crow and household income with householder between the ages 25 and 44 in the United States with a correlation coefficient (R) of -0.496 and weighted average of $71,337, a difference of 33.9%.
Householder Income Ages 25 - 44 years Correlation Summary
| Measurement | Swiss | Crow |
| Minimum | $54,762 | $24,750 |
| Maximum | $135,000 | $88,221 |
| Range | $80,238 | $63,471 |
| Mean | $86,015 | $58,648 |
| Median | $85,408 | $56,586 |
| Interquartile 25% (IQ1) | $75,688 | $46,651 |
| Interquartile 75% (IQ3) | $93,608 | $73,750 |
| Interquartile Range (IQR) | $17,920 | $27,099 |
| Standard Deviation (Sample) | $15,233 | $16,111 |
| Standard Deviation (Population) | $15,098 | $15,756 |
Similar Demographics by Householder Income Ages 25 - 44 years
Demographics Similar to Swiss by Householder Income Ages 25 - 44 years
In terms of householder income ages 25 - 44 years, the demographic groups most similar to Swiss are Immigrants from Portugal ($95,512, a difference of 0.0%), Icelander ($95,560, a difference of 0.050%), Costa Rican ($95,565, a difference of 0.060%), Immigrants from Saudi Arabia ($95,450, a difference of 0.060%), and Scandinavian ($95,596, a difference of 0.090%).
| Demographics | Rating | Rank | Householder Income Ages 25 - 44 years |
| Moroccans | 70.3 /100 | #155 | Good $96,117 |
| Immigrants | Germany | 67.9 /100 | #156 | Good $95,913 |
| Immigrants | Uganda | 65.2 /100 | #157 | Good $95,698 |
| Scandinavians | 63.9 /100 | #158 | Good $95,596 |
| Costa Ricans | 63.5 /100 | #159 | Good $95,565 |
| Icelanders | 63.4 /100 | #160 | Good $95,560 |
| Immigrants | Portugal | 62.8 /100 | #161 | Good $95,512 |
| Swiss | 62.8 /100 | #162 | Good $95,511 |
| Immigrants | Saudi Arabia | 62.0 /100 | #163 | Good $95,450 |
| South Americans | 60.9 /100 | #164 | Good $95,362 |
| Immigrants | Nepal | 60.3 /100 | #165 | Good $95,322 |
| Immigrants | Ethiopia | 59.5 /100 | #166 | Average $95,256 |
| Czechoslovakians | 57.0 /100 | #167 | Average $95,070 |
| Alsatians | 56.8 /100 | #168 | Average $95,059 |
| Native Hawaiians | 56.8 /100 | #169 | Average $95,058 |
Demographics Similar to Crow by Householder Income Ages 25 - 44 years
In terms of householder income ages 25 - 44 years, the demographic groups most similar to Crow are Arapaho ($71,697, a difference of 0.50%), Immigrants from Congo ($72,178, a difference of 1.2%), Yuman ($72,956, a difference of 2.3%), Immigrants from Yemen ($73,043, a difference of 2.4%), and Black/African American ($73,370, a difference of 2.9%).
| Demographics | Rating | Rank | Householder Income Ages 25 - 44 years |
| Hopi | 0.0 /100 | #333 | Tragic $75,002 |
| Creek | 0.0 /100 | #334 | Tragic $74,847 |
| Kiowa | 0.0 /100 | #335 | Tragic $74,776 |
| Yup'ik | 0.0 /100 | #336 | Tragic $73,688 |
| Blacks/African Americans | 0.0 /100 | #337 | Tragic $73,370 |
| Immigrants | Yemen | 0.0 /100 | #338 | Tragic $73,043 |
| Yuman | 0.0 /100 | #339 | Tragic $72,956 |
| Immigrants | Congo | 0.0 /100 | #340 | Tragic $72,178 |
| Arapaho | 0.0 /100 | #341 | Tragic $71,697 |
| Crow | 0.0 /100 | #342 | Tragic $71,337 |
| Tohono O'odham | 0.0 /100 | #343 | Tragic $69,068 |
| Pueblo | 0.0 /100 | #344 | Tragic $68,910 |
| Navajo | 0.0 /100 | #345 | Tragic $66,529 |
| Puerto Ricans | 0.0 /100 | #346 | Tragic $65,996 |
| Lumbee | 0.0 /100 | #347 | Tragic $60,305 |