Swiss vs Immigrants from Dominican Republic Householder Income Ages 25 - 44 years
COMPARE
Swiss
Immigrants from Dominican Republic
Householder Income Ages 25 - 44 years
Householder Income Ages 25 - 44 years Comparison
Swiss
Immigrants from Dominican Republic
$95,511
HOUSEHOLDER INCOME AGES 25 - 44 YEARS
62.8/ 100
METRIC RATING
162nd/ 347
METRIC RANK
$80,319
HOUSEHOLDER INCOME AGES 25 - 44 YEARS
0.0/ 100
METRIC RATING
305th/ 347
METRIC RANK
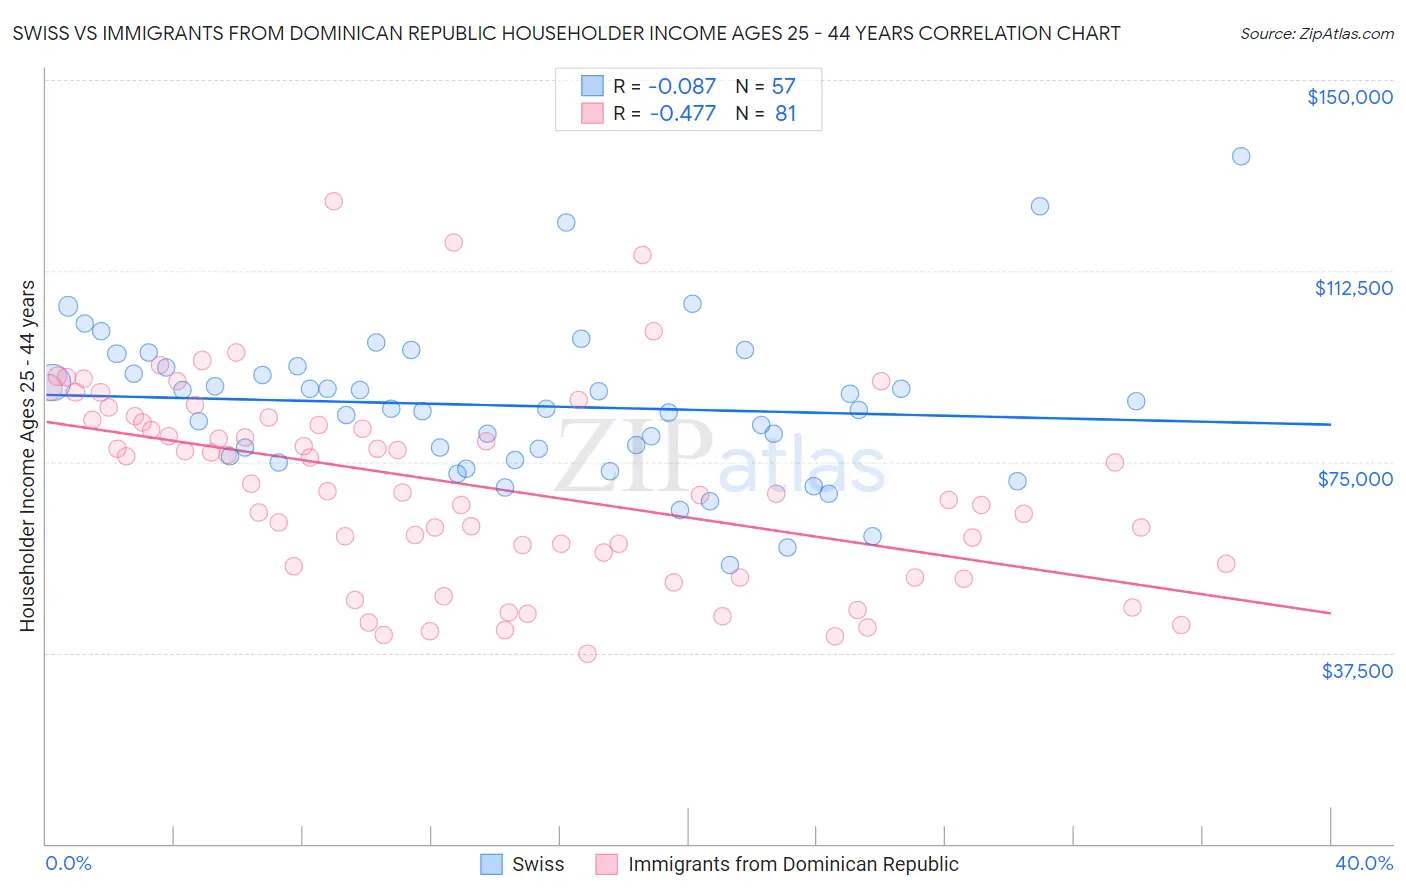
Swiss vs Immigrants from Dominican Republic Householder Income Ages 25 - 44 years Correlation Chart
The statistical analysis conducted on geographies consisting of 463,021,921 people shows a slight negative correlation between the proportion of Swiss and household income with householder between the ages 25 and 44 in the United States with a correlation coefficient (R) of -0.087 and weighted average of $95,511. Similarly, the statistical analysis conducted on geographies consisting of 274,672,798 people shows a moderate negative correlation between the proportion of Immigrants from Dominican Republic and household income with householder between the ages 25 and 44 in the United States with a correlation coefficient (R) of -0.477 and weighted average of $80,319, a difference of 18.9%.
Householder Income Ages 25 - 44 years Correlation Summary
| Measurement | Swiss | Immigrants from Dominican Republic |
| Minimum | $54,762 | $37,215 |
| Maximum | $135,000 | $126,257 |
| Range | $80,238 | $89,042 |
| Mean | $86,015 | $70,454 |
| Median | $85,408 | $69,254 |
| Interquartile 25% (IQ1) | $75,688 | $54,727 |
| Interquartile 75% (IQ3) | $93,608 | $83,452 |
| Interquartile Range (IQR) | $17,920 | $28,725 |
| Standard Deviation (Sample) | $15,233 | $19,333 |
| Standard Deviation (Population) | $15,098 | $19,213 |
Similar Demographics by Householder Income Ages 25 - 44 years
Demographics Similar to Swiss by Householder Income Ages 25 - 44 years
In terms of householder income ages 25 - 44 years, the demographic groups most similar to Swiss are Immigrants from Portugal ($95,512, a difference of 0.0%), Icelander ($95,560, a difference of 0.050%), Costa Rican ($95,565, a difference of 0.060%), Immigrants from Saudi Arabia ($95,450, a difference of 0.060%), and Scandinavian ($95,596, a difference of 0.090%).
| Demographics | Rating | Rank | Householder Income Ages 25 - 44 years |
| Moroccans | 70.3 /100 | #155 | Good $96,117 |
| Immigrants | Germany | 67.9 /100 | #156 | Good $95,913 |
| Immigrants | Uganda | 65.2 /100 | #157 | Good $95,698 |
| Scandinavians | 63.9 /100 | #158 | Good $95,596 |
| Costa Ricans | 63.5 /100 | #159 | Good $95,565 |
| Icelanders | 63.4 /100 | #160 | Good $95,560 |
| Immigrants | Portugal | 62.8 /100 | #161 | Good $95,512 |
| Swiss | 62.8 /100 | #162 | Good $95,511 |
| Immigrants | Saudi Arabia | 62.0 /100 | #163 | Good $95,450 |
| South Americans | 60.9 /100 | #164 | Good $95,362 |
| Immigrants | Nepal | 60.3 /100 | #165 | Good $95,322 |
| Immigrants | Ethiopia | 59.5 /100 | #166 | Average $95,256 |
| Czechoslovakians | 57.0 /100 | #167 | Average $95,070 |
| Alsatians | 56.8 /100 | #168 | Average $95,059 |
| Native Hawaiians | 56.8 /100 | #169 | Average $95,058 |
Demographics Similar to Immigrants from Dominican Republic by Householder Income Ages 25 - 44 years
In terms of householder income ages 25 - 44 years, the demographic groups most similar to Immigrants from Dominican Republic are Immigrants from Caribbean ($80,326, a difference of 0.010%), Apache ($80,260, a difference of 0.070%), Mexican ($80,427, a difference of 0.13%), Hispanic or Latino ($80,515, a difference of 0.24%), and Immigrants from Micronesia ($80,544, a difference of 0.28%).
| Demographics | Rating | Rank | Householder Income Ages 25 - 44 years |
| Dominicans | 0.1 /100 | #298 | Tragic $81,229 |
| Immigrants | Liberia | 0.1 /100 | #299 | Tragic $80,863 |
| Cherokee | 0.0 /100 | #300 | Tragic $80,843 |
| Immigrants | Micronesia | 0.0 /100 | #301 | Tragic $80,544 |
| Hispanics or Latinos | 0.0 /100 | #302 | Tragic $80,515 |
| Mexicans | 0.0 /100 | #303 | Tragic $80,427 |
| Immigrants | Caribbean | 0.0 /100 | #304 | Tragic $80,326 |
| Immigrants | Dominican Republic | 0.0 /100 | #305 | Tragic $80,319 |
| Apache | 0.0 /100 | #306 | Tragic $80,260 |
| Haitians | 0.0 /100 | #307 | Tragic $80,055 |
| Immigrants | Central America | 0.0 /100 | #308 | Tragic $80,012 |
| Chippewa | 0.0 /100 | #309 | Tragic $80,005 |
| Fijians | 0.0 /100 | #310 | Tragic $79,956 |
| Indonesians | 0.0 /100 | #311 | Tragic $79,543 |
| Immigrants | Haiti | 0.0 /100 | #312 | Tragic $79,391 |