Swedish vs South American Median Family Income
COMPARE
Swedish
South American
Median Family Income
Median Family Income Comparison
Swedes
South Americans
$108,499
MEDIAN FAMILY INCOME
95.1/ 100
METRIC RATING
115th/ 347
METRIC RANK
$101,856
MEDIAN FAMILY INCOME
39.7/ 100
METRIC RATING
179th/ 347
METRIC RANK
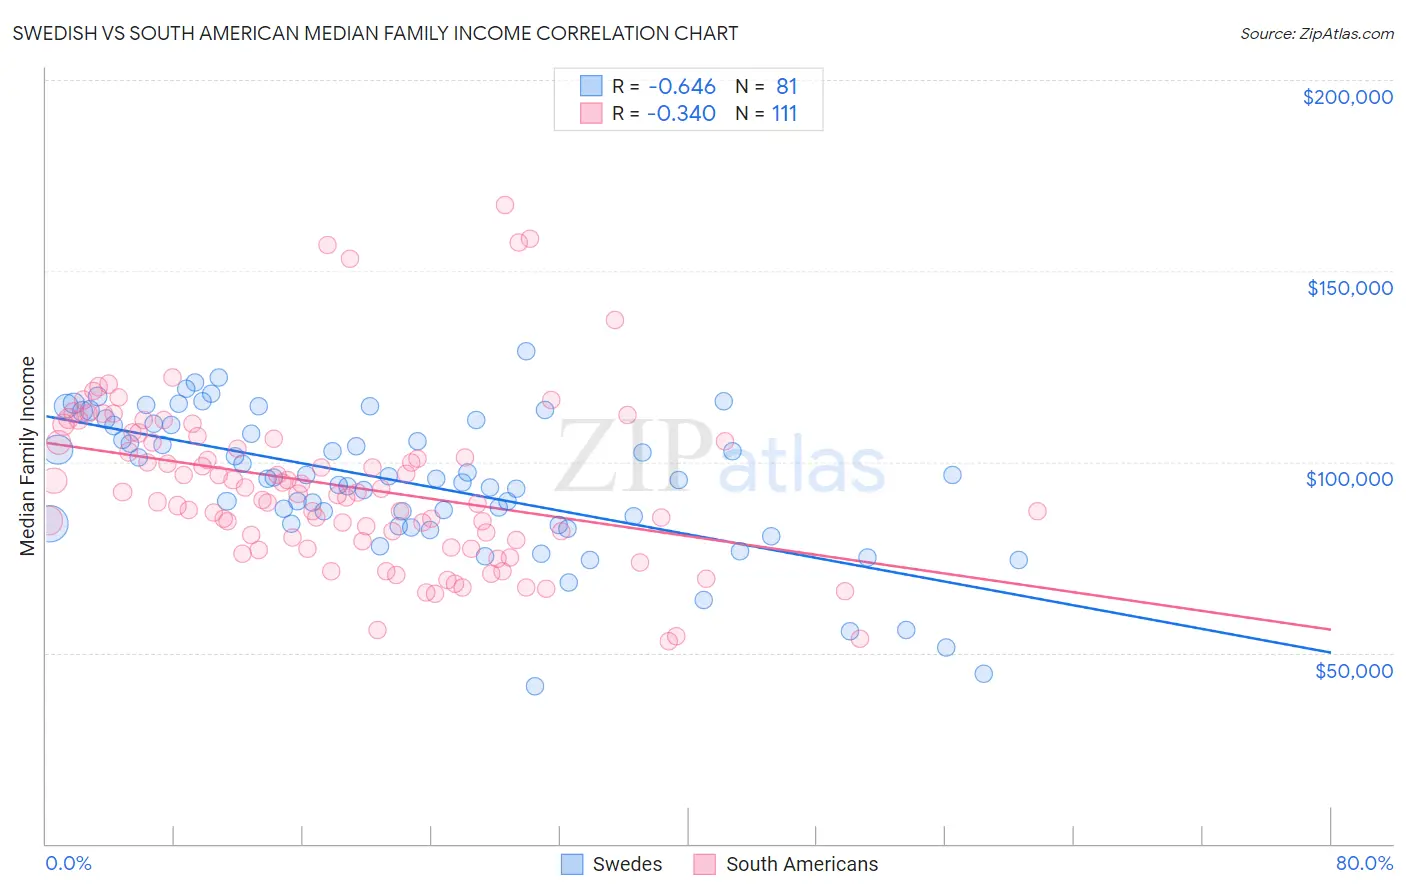
Swedish vs South American Median Family Income Correlation Chart
The statistical analysis conducted on geographies consisting of 538,326,829 people shows a significant negative correlation between the proportion of Swedes and median family income in the United States with a correlation coefficient (R) of -0.646 and weighted average of $108,499. Similarly, the statistical analysis conducted on geographies consisting of 493,360,337 people shows a mild negative correlation between the proportion of South Americans and median family income in the United States with a correlation coefficient (R) of -0.340 and weighted average of $101,856, a difference of 6.5%.
Median Family Income Correlation Summary
| Measurement | Swedish | South American |
| Minimum | $41,250 | $53,167 |
| Maximum | $128,899 | $167,114 |
| Range | $87,649 | $113,947 |
| Mean | $94,659 | $93,843 |
| Median | $95,565 | $91,692 |
| Interquartile 25% (IQ1) | $83,510 | $79,466 |
| Interquartile 75% (IQ3) | $109,800 | $105,899 |
| Interquartile Range (IQR) | $26,290 | $26,433 |
| Standard Deviation (Sample) | $18,382 | $21,858 |
| Standard Deviation (Population) | $18,268 | $21,760 |
Similar Demographics by Median Family Income
Demographics Similar to Swedes by Median Family Income
In terms of median family income, the demographic groups most similar to Swedes are Polish ($108,507, a difference of 0.010%), Immigrants from Saudi Arabia ($108,544, a difference of 0.040%), Chilean ($108,429, a difference of 0.060%), Immigrants from Poland ($108,570, a difference of 0.070%), and Immigrants from Western Asia ($108,691, a difference of 0.18%).
| Demographics | Rating | Rank | Median Family Income |
| Immigrants | Zimbabwe | 95.9 /100 | #108 | Exceptional $108,830 |
| Immigrants | Afghanistan | 95.6 /100 | #109 | Exceptional $108,709 |
| British | 95.6 /100 | #110 | Exceptional $108,705 |
| Immigrants | Western Asia | 95.6 /100 | #111 | Exceptional $108,691 |
| Immigrants | Poland | 95.3 /100 | #112 | Exceptional $108,570 |
| Immigrants | Saudi Arabia | 95.2 /100 | #113 | Exceptional $108,544 |
| Poles | 95.2 /100 | #114 | Exceptional $108,507 |
| Swedes | 95.1 /100 | #115 | Exceptional $108,499 |
| Chileans | 95.0 /100 | #116 | Exceptional $108,429 |
| Immigrants | Philippines | 94.6 /100 | #117 | Exceptional $108,288 |
| Ethiopians | 94.5 /100 | #118 | Exceptional $108,251 |
| Sri Lankans | 94.5 /100 | #119 | Exceptional $108,234 |
| Immigrants | Northern Africa | 94.3 /100 | #120 | Exceptional $108,161 |
| Europeans | 94.1 /100 | #121 | Exceptional $108,099 |
| Immigrants | Jordan | 92.9 /100 | #122 | Exceptional $107,715 |
Demographics Similar to South Americans by Median Family Income
In terms of median family income, the demographic groups most similar to South Americans are French Canadian ($101,634, a difference of 0.22%), Spaniard ($101,617, a difference of 0.23%), Welsh ($102,151, a difference of 0.29%), Tsimshian ($101,543, a difference of 0.31%), and German ($102,254, a difference of 0.39%).
| Demographics | Rating | Rank | Median Family Income |
| Immigrants | Eritrea | 51.9 /100 | #172 | Average $102,823 |
| Belgians | 51.4 /100 | #173 | Average $102,788 |
| Finns | 50.0 /100 | #174 | Average $102,676 |
| Immigrants | Eastern Africa | 47.1 /100 | #175 | Average $102,451 |
| French | 46.1 /100 | #176 | Average $102,368 |
| Germans | 44.6 /100 | #177 | Average $102,254 |
| Welsh | 43.3 /100 | #178 | Average $102,151 |
| South Americans | 39.7 /100 | #179 | Fair $101,856 |
| French Canadians | 37.0 /100 | #180 | Fair $101,634 |
| Spaniards | 36.8 /100 | #181 | Fair $101,617 |
| Tsimshian | 35.9 /100 | #182 | Fair $101,543 |
| Kenyans | 34.5 /100 | #183 | Fair $101,417 |
| Immigrants | Costa Rica | 33.7 /100 | #184 | Fair $101,354 |
| Dutch | 31.9 /100 | #185 | Fair $101,192 |
| Celtics | 31.3 /100 | #186 | Fair $101,139 |