Swedish vs Icelander Median Family Income
COMPARE
Swedish
Icelander
Median Family Income
Median Family Income Comparison
Swedes
Icelanders
$108,499
MEDIAN FAMILY INCOME
95.1/ 100
METRIC RATING
115th/ 347
METRIC RANK
$104,282
MEDIAN FAMILY INCOME
69.4/ 100
METRIC RATING
161st/ 347
METRIC RANK
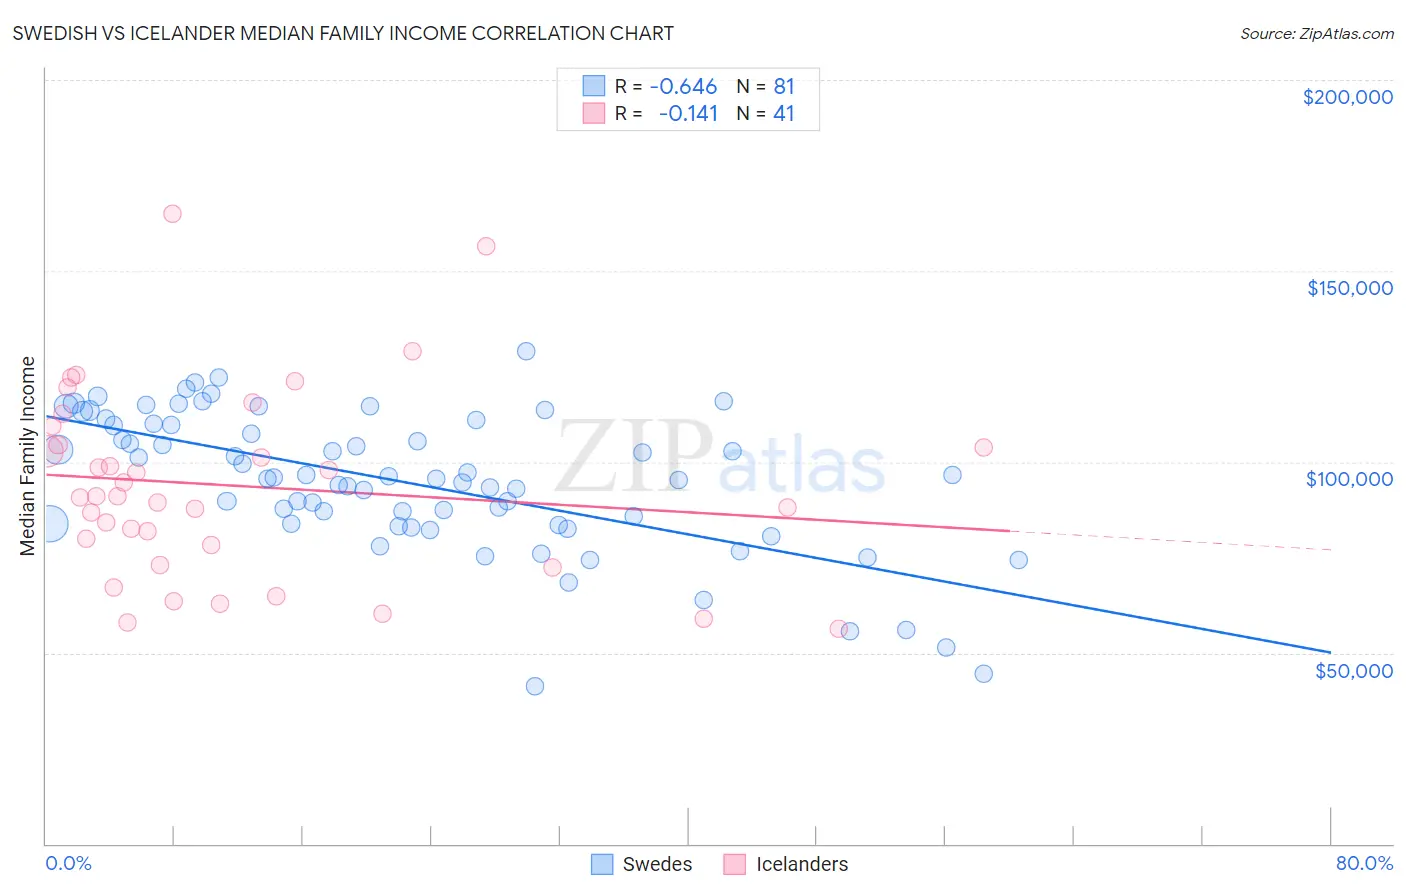
Swedish vs Icelander Median Family Income Correlation Chart
The statistical analysis conducted on geographies consisting of 538,326,829 people shows a significant negative correlation between the proportion of Swedes and median family income in the United States with a correlation coefficient (R) of -0.646 and weighted average of $108,499. Similarly, the statistical analysis conducted on geographies consisting of 159,597,543 people shows a poor negative correlation between the proportion of Icelanders and median family income in the United States with a correlation coefficient (R) of -0.141 and weighted average of $104,282, a difference of 4.0%.
Median Family Income Correlation Summary
| Measurement | Swedish | Icelander |
| Minimum | $41,250 | $56,250 |
| Maximum | $128,899 | $165,003 |
| Range | $87,649 | $108,753 |
| Mean | $94,659 | $93,671 |
| Median | $95,565 | $90,899 |
| Interquartile 25% (IQ1) | $83,510 | $75,543 |
| Interquartile 75% (IQ3) | $109,800 | $106,880 |
| Interquartile Range (IQR) | $26,290 | $31,337 |
| Standard Deviation (Sample) | $18,382 | $25,058 |
| Standard Deviation (Population) | $18,268 | $24,750 |
Similar Demographics by Median Family Income
Demographics Similar to Swedes by Median Family Income
In terms of median family income, the demographic groups most similar to Swedes are Polish ($108,507, a difference of 0.010%), Immigrants from Saudi Arabia ($108,544, a difference of 0.040%), Chilean ($108,429, a difference of 0.060%), Immigrants from Poland ($108,570, a difference of 0.070%), and Immigrants from Western Asia ($108,691, a difference of 0.18%).
| Demographics | Rating | Rank | Median Family Income |
| Immigrants | Zimbabwe | 95.9 /100 | #108 | Exceptional $108,830 |
| Immigrants | Afghanistan | 95.6 /100 | #109 | Exceptional $108,709 |
| British | 95.6 /100 | #110 | Exceptional $108,705 |
| Immigrants | Western Asia | 95.6 /100 | #111 | Exceptional $108,691 |
| Immigrants | Poland | 95.3 /100 | #112 | Exceptional $108,570 |
| Immigrants | Saudi Arabia | 95.2 /100 | #113 | Exceptional $108,544 |
| Poles | 95.2 /100 | #114 | Exceptional $108,507 |
| Swedes | 95.1 /100 | #115 | Exceptional $108,499 |
| Chileans | 95.0 /100 | #116 | Exceptional $108,429 |
| Immigrants | Philippines | 94.6 /100 | #117 | Exceptional $108,288 |
| Ethiopians | 94.5 /100 | #118 | Exceptional $108,251 |
| Sri Lankans | 94.5 /100 | #119 | Exceptional $108,234 |
| Immigrants | Northern Africa | 94.3 /100 | #120 | Exceptional $108,161 |
| Europeans | 94.1 /100 | #121 | Exceptional $108,099 |
| Immigrants | Jordan | 92.9 /100 | #122 | Exceptional $107,715 |
Demographics Similar to Icelanders by Median Family Income
In terms of median family income, the demographic groups most similar to Icelanders are Scottish ($104,288, a difference of 0.010%), Swiss ($104,396, a difference of 0.11%), Scandinavian ($104,410, a difference of 0.12%), Moroccan ($104,488, a difference of 0.20%), and Immigrants from Sierra Leone ($103,990, a difference of 0.28%).
| Demographics | Rating | Rank | Median Family Income |
| Immigrants | Nepal | 76.3 /100 | #154 | Good $104,966 |
| Native Hawaiians | 75.8 /100 | #155 | Good $104,910 |
| Basques | 74.4 /100 | #156 | Good $104,760 |
| Moroccans | 71.6 /100 | #157 | Good $104,488 |
| Scandinavians | 70.8 /100 | #158 | Good $104,410 |
| Swiss | 70.7 /100 | #159 | Good $104,396 |
| Scottish | 69.5 /100 | #160 | Good $104,288 |
| Icelanders | 69.4 /100 | #161 | Good $104,282 |
| Immigrants | Sierra Leone | 66.2 /100 | #162 | Good $103,990 |
| Costa Ricans | 66.2 /100 | #163 | Good $103,989 |
| Sierra Leoneans | 64.7 /100 | #164 | Good $103,859 |
| Slovaks | 63.1 /100 | #165 | Good $103,729 |
| English | 62.6 /100 | #166 | Good $103,684 |
| South American Indians | 61.9 /100 | #167 | Good $103,624 |
| Immigrants | Peru | 60.8 /100 | #168 | Good $103,534 |