Immigrants from Australia vs South American Median Family Income
COMPARE
Immigrants from Australia
South American
Median Family Income
Median Family Income Comparison
Immigrants from Australia
South Americans
$126,620
MEDIAN FAMILY INCOME
100.0/ 100
METRIC RATING
13th/ 347
METRIC RANK
$101,856
MEDIAN FAMILY INCOME
39.7/ 100
METRIC RATING
179th/ 347
METRIC RANK
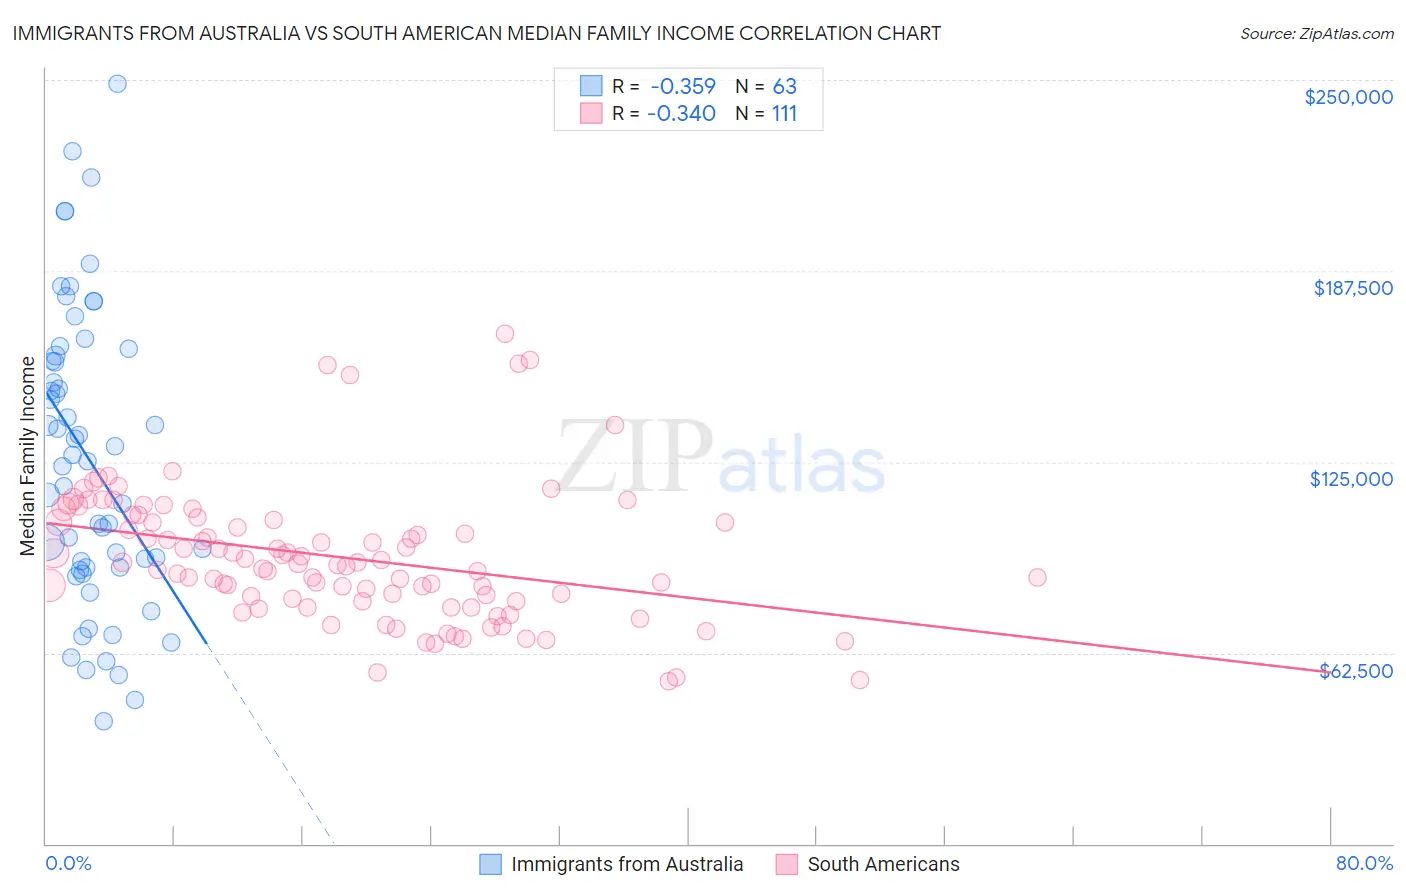
Immigrants from Australia vs South American Median Family Income Correlation Chart
The statistical analysis conducted on geographies consisting of 227,105,113 people shows a mild negative correlation between the proportion of Immigrants from Australia and median family income in the United States with a correlation coefficient (R) of -0.359 and weighted average of $126,620. Similarly, the statistical analysis conducted on geographies consisting of 493,360,337 people shows a mild negative correlation between the proportion of South Americans and median family income in the United States with a correlation coefficient (R) of -0.340 and weighted average of $101,856, a difference of 24.3%.
Median Family Income Correlation Summary
| Measurement | Immigrants from Australia | South American |
| Minimum | $40,038 | $53,167 |
| Maximum | $248,750 | $167,114 |
| Range | $208,712 | $113,947 |
| Mean | $125,759 | $93,843 |
| Median | $125,053 | $91,692 |
| Interquartile 25% (IQ1) | $90,291 | $79,466 |
| Interquartile 75% (IQ3) | $159,793 | $105,899 |
| Interquartile Range (IQR) | $69,502 | $26,433 |
| Standard Deviation (Sample) | $48,023 | $21,858 |
| Standard Deviation (Population) | $47,640 | $21,760 |
Similar Demographics by Median Family Income
Demographics Similar to Immigrants from Australia by Median Family Income
In terms of median family income, the demographic groups most similar to Immigrants from Australia are Cypriot ($127,064, a difference of 0.35%), Immigrants from South Central Asia ($125,956, a difference of 0.53%), Immigrants from Israel ($127,430, a difference of 0.64%), Immigrants from Ireland ($127,584, a difference of 0.76%), and Eastern European ($125,546, a difference of 0.86%).
| Demographics | Rating | Rank | Median Family Income |
| Thais | 100.0 /100 | #6 | Exceptional $131,281 |
| Immigrants | Hong Kong | 100.0 /100 | #7 | Exceptional $131,067 |
| Immigrants | Iran | 100.0 /100 | #8 | Exceptional $130,894 |
| Okinawans | 100.0 /100 | #9 | Exceptional $129,979 |
| Immigrants | Ireland | 100.0 /100 | #10 | Exceptional $127,584 |
| Immigrants | Israel | 100.0 /100 | #11 | Exceptional $127,430 |
| Cypriots | 100.0 /100 | #12 | Exceptional $127,064 |
| Immigrants | Australia | 100.0 /100 | #13 | Exceptional $126,620 |
| Immigrants | South Central Asia | 100.0 /100 | #14 | Exceptional $125,956 |
| Eastern Europeans | 100.0 /100 | #15 | Exceptional $125,546 |
| Immigrants | China | 100.0 /100 | #16 | Exceptional $125,540 |
| Indians (Asian) | 100.0 /100 | #17 | Exceptional $125,312 |
| Immigrants | Eastern Asia | 100.0 /100 | #18 | Exceptional $125,150 |
| Immigrants | Belgium | 100.0 /100 | #19 | Exceptional $123,831 |
| Burmese | 100.0 /100 | #20 | Exceptional $123,369 |
Demographics Similar to South Americans by Median Family Income
In terms of median family income, the demographic groups most similar to South Americans are French Canadian ($101,634, a difference of 0.22%), Spaniard ($101,617, a difference of 0.23%), Welsh ($102,151, a difference of 0.29%), Tsimshian ($101,543, a difference of 0.31%), and German ($102,254, a difference of 0.39%).
| Demographics | Rating | Rank | Median Family Income |
| Immigrants | Eritrea | 51.9 /100 | #172 | Average $102,823 |
| Belgians | 51.4 /100 | #173 | Average $102,788 |
| Finns | 50.0 /100 | #174 | Average $102,676 |
| Immigrants | Eastern Africa | 47.1 /100 | #175 | Average $102,451 |
| French | 46.1 /100 | #176 | Average $102,368 |
| Germans | 44.6 /100 | #177 | Average $102,254 |
| Welsh | 43.3 /100 | #178 | Average $102,151 |
| South Americans | 39.7 /100 | #179 | Fair $101,856 |
| French Canadians | 37.0 /100 | #180 | Fair $101,634 |
| Spaniards | 36.8 /100 | #181 | Fair $101,617 |
| Tsimshian | 35.9 /100 | #182 | Fair $101,543 |
| Kenyans | 34.5 /100 | #183 | Fair $101,417 |
| Immigrants | Costa Rica | 33.7 /100 | #184 | Fair $101,354 |
| Dutch | 31.9 /100 | #185 | Fair $101,192 |
| Celtics | 31.3 /100 | #186 | Fair $101,139 |