Swedish vs Immigrants from Indonesia Median Family Income
COMPARE
Swedish
Immigrants from Indonesia
Median Family Income
Median Family Income Comparison
Swedes
Immigrants from Indonesia
$108,499
MEDIAN FAMILY INCOME
95.1/ 100
METRIC RATING
115th/ 347
METRIC RANK
$115,162
MEDIAN FAMILY INCOME
99.8/ 100
METRIC RATING
58th/ 347
METRIC RANK
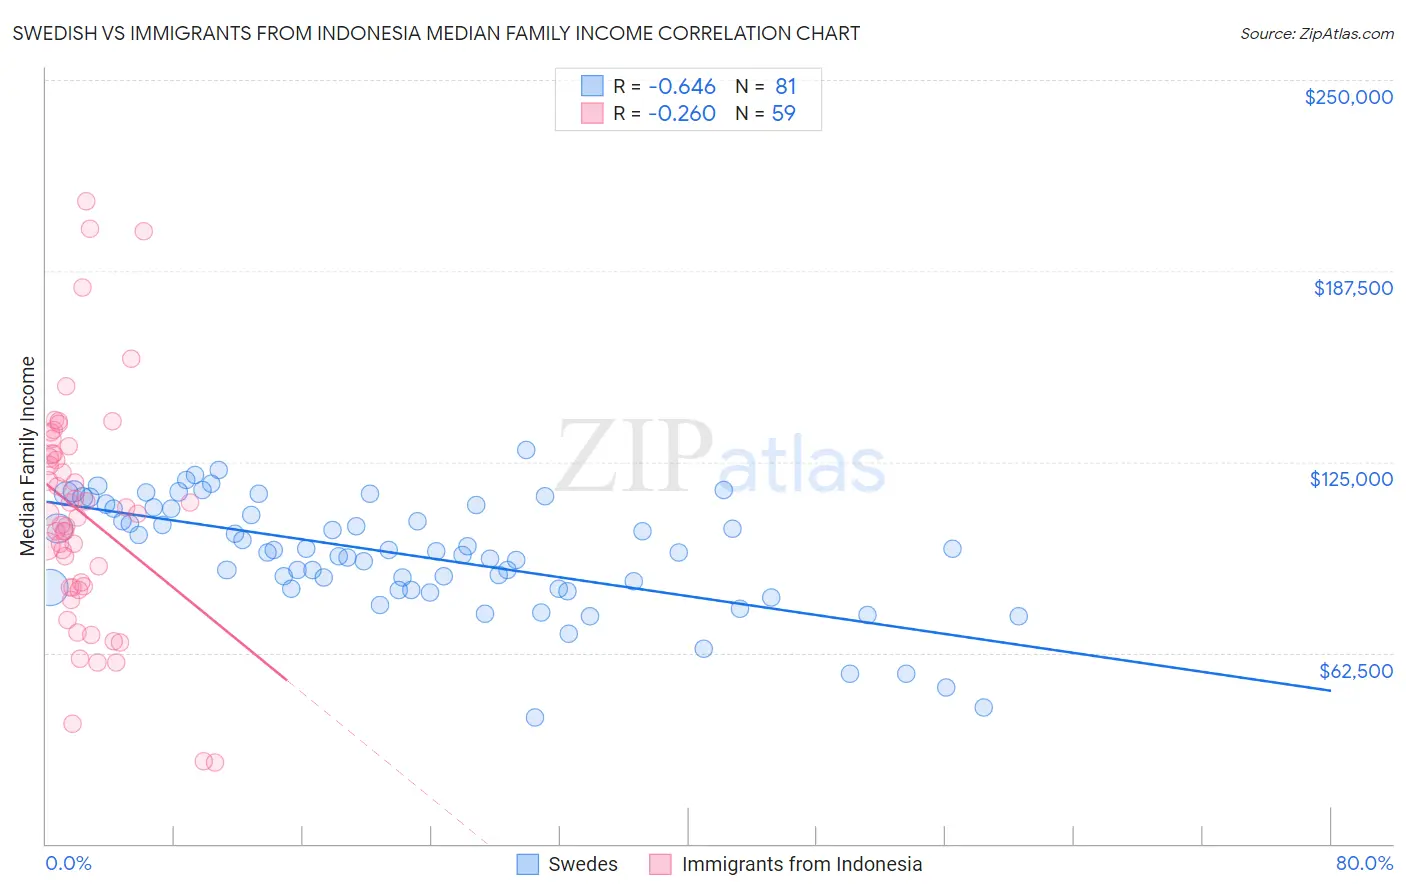
Swedish vs Immigrants from Indonesia Median Family Income Correlation Chart
The statistical analysis conducted on geographies consisting of 538,326,829 people shows a significant negative correlation between the proportion of Swedes and median family income in the United States with a correlation coefficient (R) of -0.646 and weighted average of $108,499. Similarly, the statistical analysis conducted on geographies consisting of 215,683,063 people shows a weak negative correlation between the proportion of Immigrants from Indonesia and median family income in the United States with a correlation coefficient (R) of -0.260 and weighted average of $115,162, a difference of 6.1%.
Median Family Income Correlation Summary
| Measurement | Swedish | Immigrants from Indonesia |
| Minimum | $41,250 | $26,694 |
| Maximum | $128,899 | $210,375 |
| Range | $87,649 | $183,681 |
| Mean | $94,659 | $108,164 |
| Median | $95,565 | $108,113 |
| Interquartile 25% (IQ1) | $83,510 | $84,077 |
| Interquartile 75% (IQ3) | $109,800 | $127,666 |
| Interquartile Range (IQR) | $26,290 | $43,589 |
| Standard Deviation (Sample) | $18,382 | $37,920 |
| Standard Deviation (Population) | $18,268 | $37,598 |
Similar Demographics by Median Family Income
Demographics Similar to Swedes by Median Family Income
In terms of median family income, the demographic groups most similar to Swedes are Polish ($108,507, a difference of 0.010%), Immigrants from Saudi Arabia ($108,544, a difference of 0.040%), Chilean ($108,429, a difference of 0.060%), Immigrants from Poland ($108,570, a difference of 0.070%), and Immigrants from Western Asia ($108,691, a difference of 0.18%).
| Demographics | Rating | Rank | Median Family Income |
| Immigrants | Zimbabwe | 95.9 /100 | #108 | Exceptional $108,830 |
| Immigrants | Afghanistan | 95.6 /100 | #109 | Exceptional $108,709 |
| British | 95.6 /100 | #110 | Exceptional $108,705 |
| Immigrants | Western Asia | 95.6 /100 | #111 | Exceptional $108,691 |
| Immigrants | Poland | 95.3 /100 | #112 | Exceptional $108,570 |
| Immigrants | Saudi Arabia | 95.2 /100 | #113 | Exceptional $108,544 |
| Poles | 95.2 /100 | #114 | Exceptional $108,507 |
| Swedes | 95.1 /100 | #115 | Exceptional $108,499 |
| Chileans | 95.0 /100 | #116 | Exceptional $108,429 |
| Immigrants | Philippines | 94.6 /100 | #117 | Exceptional $108,288 |
| Ethiopians | 94.5 /100 | #118 | Exceptional $108,251 |
| Sri Lankans | 94.5 /100 | #119 | Exceptional $108,234 |
| Immigrants | Northern Africa | 94.3 /100 | #120 | Exceptional $108,161 |
| Europeans | 94.1 /100 | #121 | Exceptional $108,099 |
| Immigrants | Jordan | 92.9 /100 | #122 | Exceptional $107,715 |
Demographics Similar to Immigrants from Indonesia by Median Family Income
In terms of median family income, the demographic groups most similar to Immigrants from Indonesia are Greek ($115,192, a difference of 0.030%), New Zealander ($115,230, a difference of 0.060%), Immigrants from Netherlands ($114,987, a difference of 0.15%), Lithuanian ($115,395, a difference of 0.20%), and Immigrants from Latvia ($114,826, a difference of 0.29%).
| Demographics | Rating | Rank | Median Family Income |
| Immigrants | Malaysia | 99.9 /100 | #51 | Exceptional $115,880 |
| Maltese | 99.9 /100 | #52 | Exceptional $115,862 |
| Immigrants | Norway | 99.9 /100 | #53 | Exceptional $115,847 |
| Immigrants | Europe | 99.9 /100 | #54 | Exceptional $115,523 |
| Lithuanians | 99.8 /100 | #55 | Exceptional $115,395 |
| New Zealanders | 99.8 /100 | #56 | Exceptional $115,230 |
| Greeks | 99.8 /100 | #57 | Exceptional $115,192 |
| Immigrants | Indonesia | 99.8 /100 | #58 | Exceptional $115,162 |
| Immigrants | Netherlands | 99.8 /100 | #59 | Exceptional $114,987 |
| Immigrants | Latvia | 99.8 /100 | #60 | Exceptional $114,826 |
| Immigrants | Belarus | 99.8 /100 | #61 | Exceptional $114,586 |
| Mongolians | 99.8 /100 | #62 | Exceptional $114,553 |
| Immigrants | Pakistan | 99.8 /100 | #63 | Exceptional $114,406 |
| Immigrants | Scotland | 99.7 /100 | #64 | Exceptional $114,392 |
| Egyptians | 99.7 /100 | #65 | Exceptional $114,119 |