Sudanese vs Croatian Householder Income Under 25 years
COMPARE
Sudanese
Croatian
Householder Income Under 25 years
Householder Income Under 25 years Comparison
Sudanese
Croatians
$46,982
HOUSEHOLDER INCOME UNDER 25 YEARS
0.0/ 100
METRIC RATING
316th/ 347
METRIC RANK
$51,662
HOUSEHOLDER INCOME UNDER 25 YEARS
21.6/ 100
METRIC RATING
189th/ 347
METRIC RANK
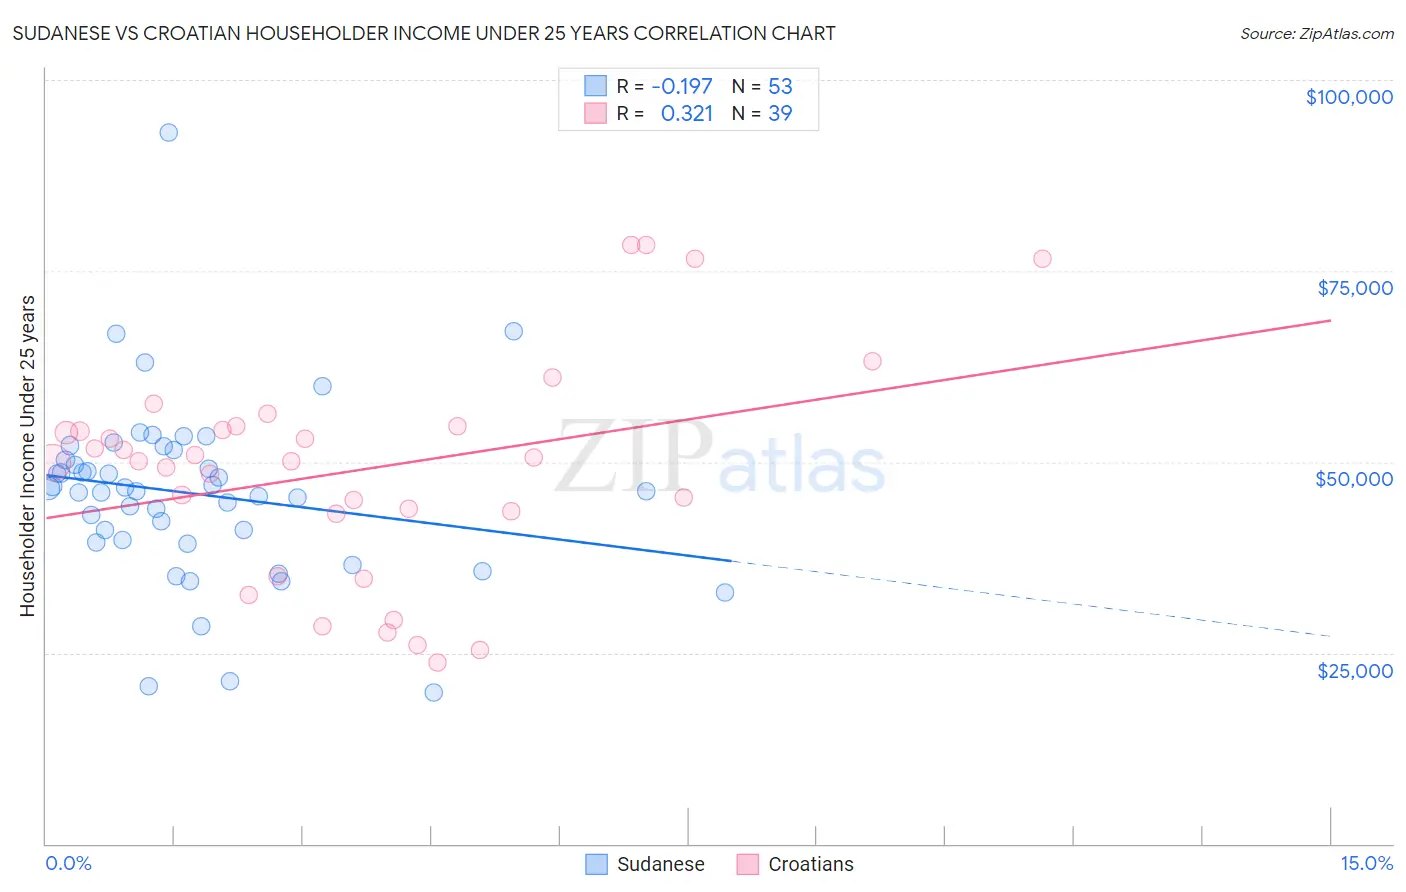
Sudanese vs Croatian Householder Income Under 25 years Correlation Chart
The statistical analysis conducted on geographies consisting of 104,582,172 people shows a poor negative correlation between the proportion of Sudanese and household income with householder under the age of 25 in the United States with a correlation coefficient (R) of -0.197 and weighted average of $46,982. Similarly, the statistical analysis conducted on geographies consisting of 315,055,397 people shows a mild positive correlation between the proportion of Croatians and household income with householder under the age of 25 in the United States with a correlation coefficient (R) of 0.321 and weighted average of $51,662, a difference of 10.0%.
Householder Income Under 25 years Correlation Summary
| Measurement | Sudanese | Croatian |
| Minimum | $19,757 | $23,750 |
| Maximum | $93,063 | $78,352 |
| Range | $73,306 | $54,602 |
| Mean | $45,800 | $48,905 |
| Median | $46,181 | $50,153 |
| Interquartile 25% (IQ1) | $39,636 | $43,159 |
| Interquartile 75% (IQ3) | $50,904 | $54,688 |
| Interquartile Range (IQR) | $11,268 | $11,529 |
| Standard Deviation (Sample) | $11,891 | $14,236 |
| Standard Deviation (Population) | $11,778 | $14,052 |
Similar Demographics by Householder Income Under 25 years
Demographics Similar to Sudanese by Householder Income Under 25 years
In terms of householder income under 25 years, the demographic groups most similar to Sudanese are Hopi ($46,978, a difference of 0.010%), Crow ($47,012, a difference of 0.060%), Chippewa ($47,015, a difference of 0.070%), Spanish American ($46,913, a difference of 0.15%), and African ($46,838, a difference of 0.31%).
| Demographics | Rating | Rank | Householder Income Under 25 years |
| U.S. Virgin Islanders | 0.0 /100 | #309 | Tragic $47,448 |
| Iroquois | 0.0 /100 | #310 | Tragic $47,380 |
| Ottawa | 0.0 /100 | #311 | Tragic $47,366 |
| Bermudans | 0.0 /100 | #312 | Tragic $47,359 |
| Delaware | 0.0 /100 | #313 | Tragic $47,159 |
| Chippewa | 0.0 /100 | #314 | Tragic $47,015 |
| Crow | 0.0 /100 | #315 | Tragic $47,012 |
| Sudanese | 0.0 /100 | #316 | Tragic $46,982 |
| Hopi | 0.0 /100 | #317 | Tragic $46,978 |
| Spanish Americans | 0.0 /100 | #318 | Tragic $46,913 |
| Africans | 0.0 /100 | #319 | Tragic $46,838 |
| Immigrants | Sudan | 0.0 /100 | #320 | Tragic $46,791 |
| Potawatomi | 0.0 /100 | #321 | Tragic $46,462 |
| Sioux | 0.0 /100 | #322 | Tragic $46,417 |
| Immigrants | Saudi Arabia | 0.0 /100 | #323 | Tragic $46,187 |
Demographics Similar to Croatians by Householder Income Under 25 years
In terms of householder income under 25 years, the demographic groups most similar to Croatians are Northern European ($51,678, a difference of 0.030%), Immigrants from South Africa ($51,705, a difference of 0.080%), Malaysian ($51,615, a difference of 0.090%), Alaskan Athabascan ($51,713, a difference of 0.10%), and Panamanian ($51,611, a difference of 0.10%).
| Demographics | Rating | Rank | Householder Income Under 25 years |
| Jordanians | 27.6 /100 | #182 | Fair $51,796 |
| Mexican American Indians | 27.0 /100 | #183 | Fair $51,783 |
| Paiute | 25.1 /100 | #184 | Fair $51,743 |
| Immigrants | Latvia | 24.8 /100 | #185 | Fair $51,737 |
| Alaskan Athabascans | 23.8 /100 | #186 | Fair $51,713 |
| Immigrants | South Africa | 23.4 /100 | #187 | Fair $51,705 |
| Northern Europeans | 22.2 /100 | #188 | Fair $51,678 |
| Croatians | 21.6 /100 | #189 | Fair $51,662 |
| Malaysians | 19.7 /100 | #190 | Poor $51,615 |
| Panamanians | 19.5 /100 | #191 | Poor $51,611 |
| West Indians | 18.5 /100 | #192 | Poor $51,583 |
| Immigrants | Eritrea | 18.1 /100 | #193 | Poor $51,574 |
| Guatemalans | 16.4 /100 | #194 | Poor $51,525 |
| Estonians | 16.4 /100 | #195 | Poor $51,523 |
| Palestinians | 16.1 /100 | #196 | Poor $51,515 |