Sudanese vs Croatian 4th Grade
COMPARE
Sudanese
Croatian
4th Grade
4th Grade Comparison
Sudanese
Croatians
97.3%
4TH GRADE
9.0/ 100
METRIC RATING
211th/ 347
METRIC RANK
98.3%
4TH GRADE
100.0/ 100
METRIC RATING
26th/ 347
METRIC RANK
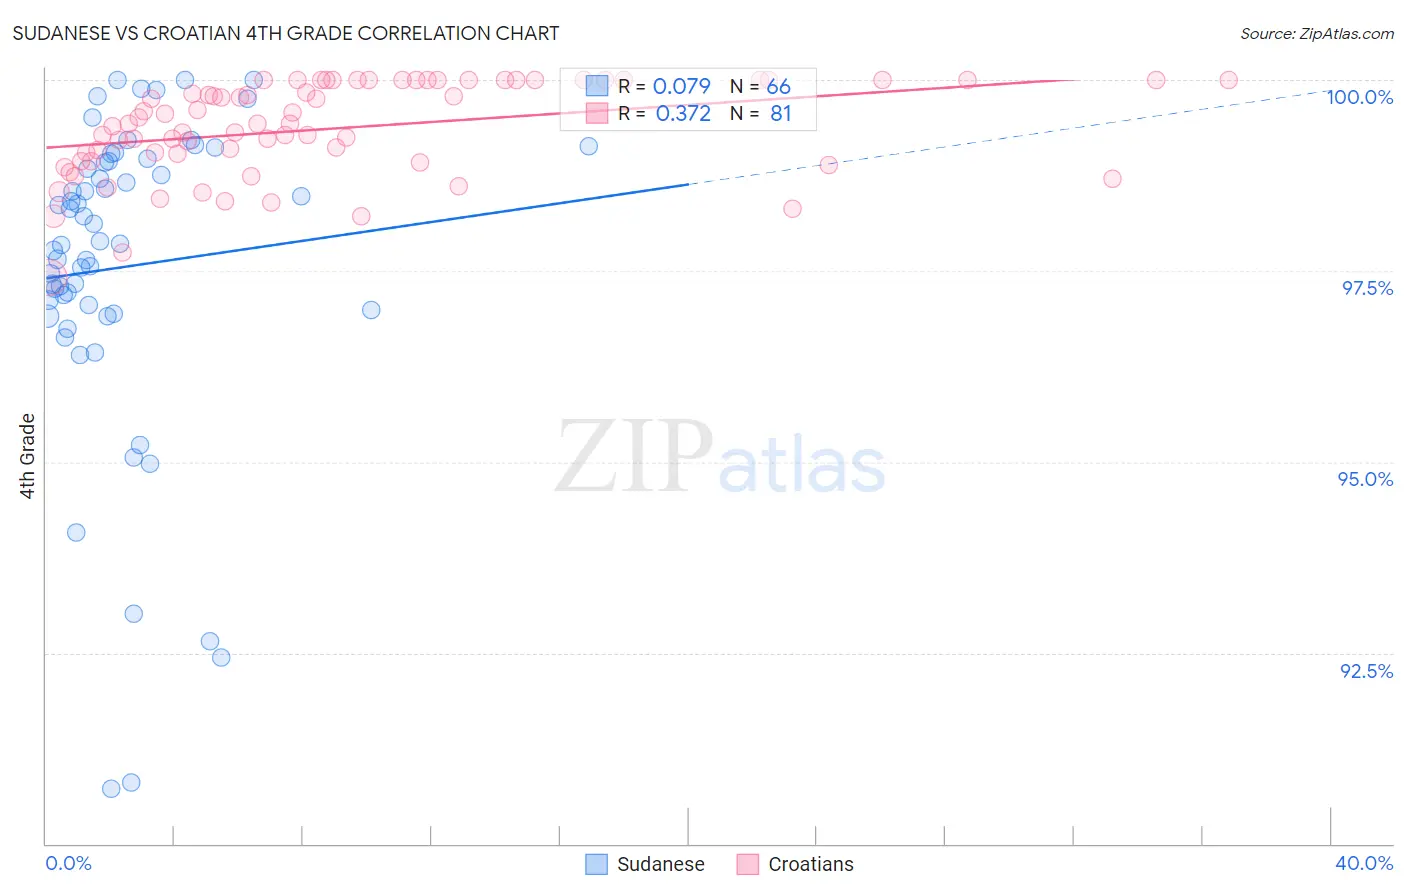
Sudanese vs Croatian 4th Grade Correlation Chart
The statistical analysis conducted on geographies consisting of 110,135,898 people shows a slight positive correlation between the proportion of Sudanese and percentage of population with at least 4th grade education in the United States with a correlation coefficient (R) of 0.079 and weighted average of 97.3%. Similarly, the statistical analysis conducted on geographies consisting of 375,731,938 people shows a mild positive correlation between the proportion of Croatians and percentage of population with at least 4th grade education in the United States with a correlation coefficient (R) of 0.372 and weighted average of 98.3%, a difference of 1.0%.
4th Grade Correlation Summary
| Measurement | Sudanese | Croatian |
| Minimum | 90.7% | 97.4% |
| Maximum | 100.0% | 100.0% |
| Range | 9.3% | 2.6% |
| Mean | 97.6% | 99.4% |
| Median | 97.9% | 99.4% |
| Interquartile 25% (IQ1) | 97.0% | 98.9% |
| Interquartile 75% (IQ3) | 98.9% | 100.0% |
| Interquartile Range (IQR) | 1.9% | 1.1% |
| Standard Deviation (Sample) | 2.1% | 0.62% |
| Standard Deviation (Population) | 2.1% | 0.61% |
Similar Demographics by 4th Grade
Demographics Similar to Sudanese by 4th Grade
In terms of 4th grade, the demographic groups most similar to Sudanese are Laotian (97.3%, a difference of 0.0%), Immigrants from Oceania (97.3%, a difference of 0.0%), Tohono O'odham (97.3%, a difference of 0.010%), Costa Rican (97.3%, a difference of 0.010%), and Moroccan (97.3%, a difference of 0.020%).
| Demographics | Rating | Rank | 4th Grade |
| Africans | 14.6 /100 | #204 | Poor 97.4% |
| Paiute | 13.2 /100 | #205 | Poor 97.3% |
| Immigrants | Zaire | 12.8 /100 | #206 | Poor 97.3% |
| Moroccans | 11.3 /100 | #207 | Poor 97.3% |
| Immigrants | Bahamas | 10.8 /100 | #208 | Poor 97.3% |
| Laotians | 9.3 /100 | #209 | Tragic 97.3% |
| Immigrants | Oceania | 9.1 /100 | #210 | Tragic 97.3% |
| Sudanese | 9.0 /100 | #211 | Tragic 97.3% |
| Tohono O'odham | 8.4 /100 | #212 | Tragic 97.3% |
| Costa Ricans | 8.3 /100 | #213 | Tragic 97.3% |
| Immigrants | Nepal | 7.7 /100 | #214 | Tragic 97.3% |
| Immigrants | Morocco | 7.1 /100 | #215 | Tragic 97.3% |
| Samoans | 6.8 /100 | #216 | Tragic 97.3% |
| Sierra Leoneans | 6.5 /100 | #217 | Tragic 97.3% |
| Iraqis | 6.3 /100 | #218 | Tragic 97.3% |
Demographics Similar to Croatians by 4th Grade
In terms of 4th grade, the demographic groups most similar to Croatians are Scotch-Irish (98.3%, a difference of 0.0%), Danish (98.3%, a difference of 0.010%), French Canadian (98.3%, a difference of 0.010%), French (98.3%, a difference of 0.010%), and Sioux (98.3%, a difference of 0.020%).
| Demographics | Rating | Rank | 4th Grade |
| Irish | 100.0 /100 | #19 | Exceptional 98.4% |
| Alaska Natives | 100.0 /100 | #20 | Exceptional 98.4% |
| Lithuanians | 100.0 /100 | #21 | Exceptional 98.3% |
| Finns | 100.0 /100 | #22 | Exceptional 98.3% |
| Sioux | 100.0 /100 | #23 | Exceptional 98.3% |
| Danes | 100.0 /100 | #24 | Exceptional 98.3% |
| Scotch-Irish | 100.0 /100 | #25 | Exceptional 98.3% |
| Croatians | 100.0 /100 | #26 | Exceptional 98.3% |
| French Canadians | 100.0 /100 | #27 | Exceptional 98.3% |
| French | 100.0 /100 | #28 | Exceptional 98.3% |
| Czechs | 100.0 /100 | #29 | Exceptional 98.3% |
| Scandinavians | 100.0 /100 | #30 | Exceptional 98.3% |
| Europeans | 100.0 /100 | #31 | Exceptional 98.3% |
| Chinese | 100.0 /100 | #32 | Exceptional 98.3% |
| Swiss | 100.0 /100 | #33 | Exceptional 98.2% |