Sri Lankan vs Venezuelan Householder Income Under 25 years
COMPARE
Sri Lankan
Venezuelan
Householder Income Under 25 years
Householder Income Under 25 years Comparison
Sri Lankans
Venezuelans
$55,470
HOUSEHOLDER INCOME UNDER 25 YEARS
100.0/ 100
METRIC RATING
54th/ 347
METRIC RANK
$50,011
HOUSEHOLDER INCOME UNDER 25 YEARS
0.5/ 100
METRIC RATING
268th/ 347
METRIC RANK
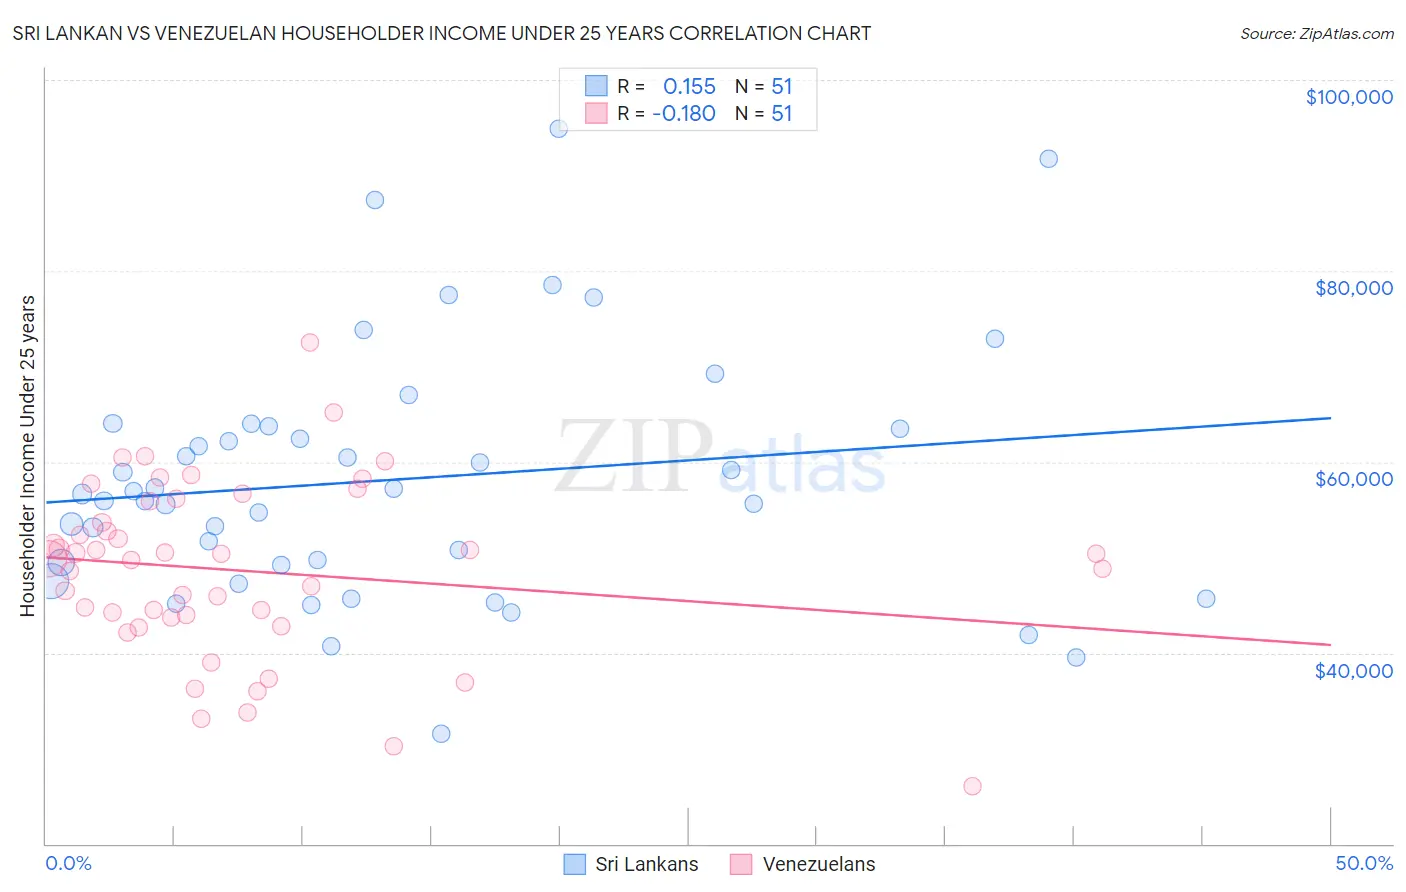
Sri Lankan vs Venezuelan Householder Income Under 25 years Correlation Chart
The statistical analysis conducted on geographies consisting of 370,884,989 people shows a poor positive correlation between the proportion of Sri Lankans and household income with householder under the age of 25 in the United States with a correlation coefficient (R) of 0.155 and weighted average of $55,470. Similarly, the statistical analysis conducted on geographies consisting of 267,458,275 people shows a poor negative correlation between the proportion of Venezuelans and household income with householder under the age of 25 in the United States with a correlation coefficient (R) of -0.180 and weighted average of $50,011, a difference of 10.9%.
Householder Income Under 25 years Correlation Summary
| Measurement | Sri Lankan | Venezuelan |
| Minimum | $31,569 | $26,011 |
| Maximum | $94,955 | $72,500 |
| Range | $63,386 | $46,489 |
| Mean | $58,171 | $48,579 |
| Median | $56,661 | $49,832 |
| Interquartile 25% (IQ1) | $49,199 | $43,664 |
| Interquartile 75% (IQ3) | $63,744 | $55,823 |
| Interquartile Range (IQR) | $14,546 | $12,159 |
| Standard Deviation (Sample) | $13,154 | $9,174 |
| Standard Deviation (Population) | $13,025 | $9,084 |
Similar Demographics by Householder Income Under 25 years
Demographics Similar to Sri Lankans by Householder Income Under 25 years
In terms of householder income under 25 years, the demographic groups most similar to Sri Lankans are Immigrants from Poland ($55,474, a difference of 0.010%), Immigrants from Ukraine ($55,447, a difference of 0.040%), Immigrants from Romania ($55,522, a difference of 0.090%), Immigrants from Indonesia ($55,521, a difference of 0.090%), and Salvadoran ($55,412, a difference of 0.10%).
| Demographics | Rating | Rank | Householder Income Under 25 years |
| Cambodians | 100.0 /100 | #47 | Exceptional $55,571 |
| Immigrants | Vietnam | 100.0 /100 | #48 | Exceptional $55,562 |
| Iranians | 100.0 /100 | #49 | Exceptional $55,548 |
| Puget Sound Salish | 100.0 /100 | #50 | Exceptional $55,543 |
| Immigrants | Romania | 100.0 /100 | #51 | Exceptional $55,522 |
| Immigrants | Indonesia | 100.0 /100 | #52 | Exceptional $55,521 |
| Immigrants | Poland | 100.0 /100 | #53 | Exceptional $55,474 |
| Sri Lankans | 100.0 /100 | #54 | Exceptional $55,470 |
| Immigrants | Ukraine | 100.0 /100 | #55 | Exceptional $55,447 |
| Salvadorans | 100.0 /100 | #56 | Exceptional $55,412 |
| Soviet Union | 100.0 /100 | #57 | Exceptional $55,340 |
| Guyanese | 99.9 /100 | #58 | Exceptional $55,210 |
| Native Hawaiians | 99.9 /100 | #59 | Exceptional $55,158 |
| Immigrants | Lithuania | 99.9 /100 | #60 | Exceptional $55,028 |
| Immigrants | Europe | 99.9 /100 | #61 | Exceptional $55,022 |
Demographics Similar to Venezuelans by Householder Income Under 25 years
In terms of householder income under 25 years, the demographic groups most similar to Venezuelans are Ute ($49,997, a difference of 0.030%), Mexican ($49,989, a difference of 0.040%), Immigrants from Laos ($50,041, a difference of 0.060%), Immigrants from Venezuela ($50,109, a difference of 0.19%), and Belgian ($50,113, a difference of 0.20%).
| Demographics | Rating | Rank | Householder Income Under 25 years |
| Hungarians | 0.9 /100 | #261 | Tragic $50,247 |
| Haitians | 0.8 /100 | #262 | Tragic $50,231 |
| Immigrants | Dominican Republic | 0.8 /100 | #263 | Tragic $50,204 |
| Fijians | 0.6 /100 | #264 | Tragic $50,132 |
| Belgians | 0.6 /100 | #265 | Tragic $50,113 |
| Immigrants | Venezuela | 0.6 /100 | #266 | Tragic $50,109 |
| Immigrants | Laos | 0.5 /100 | #267 | Tragic $50,041 |
| Venezuelans | 0.5 /100 | #268 | Tragic $50,011 |
| Ute | 0.5 /100 | #269 | Tragic $49,997 |
| Mexicans | 0.5 /100 | #270 | Tragic $49,989 |
| Taiwanese | 0.3 /100 | #271 | Tragic $49,804 |
| Colville | 0.3 /100 | #272 | Tragic $49,774 |
| Slovaks | 0.3 /100 | #273 | Tragic $49,753 |
| Immigrants | Senegal | 0.3 /100 | #274 | Tragic $49,742 |
| Immigrants | Kenya | 0.2 /100 | #275 | Tragic $49,633 |