Sri Lankan vs Immigrants from Haiti Householder Income Under 25 years
COMPARE
Sri Lankan
Immigrants from Haiti
Householder Income Under 25 years
Householder Income Under 25 years Comparison
Sri Lankans
Immigrants from Haiti
$55,470
HOUSEHOLDER INCOME UNDER 25 YEARS
100.0/ 100
METRIC RATING
54th/ 347
METRIC RANK
$50,398
HOUSEHOLDER INCOME UNDER 25 YEARS
1.2/ 100
METRIC RATING
253rd/ 347
METRIC RANK
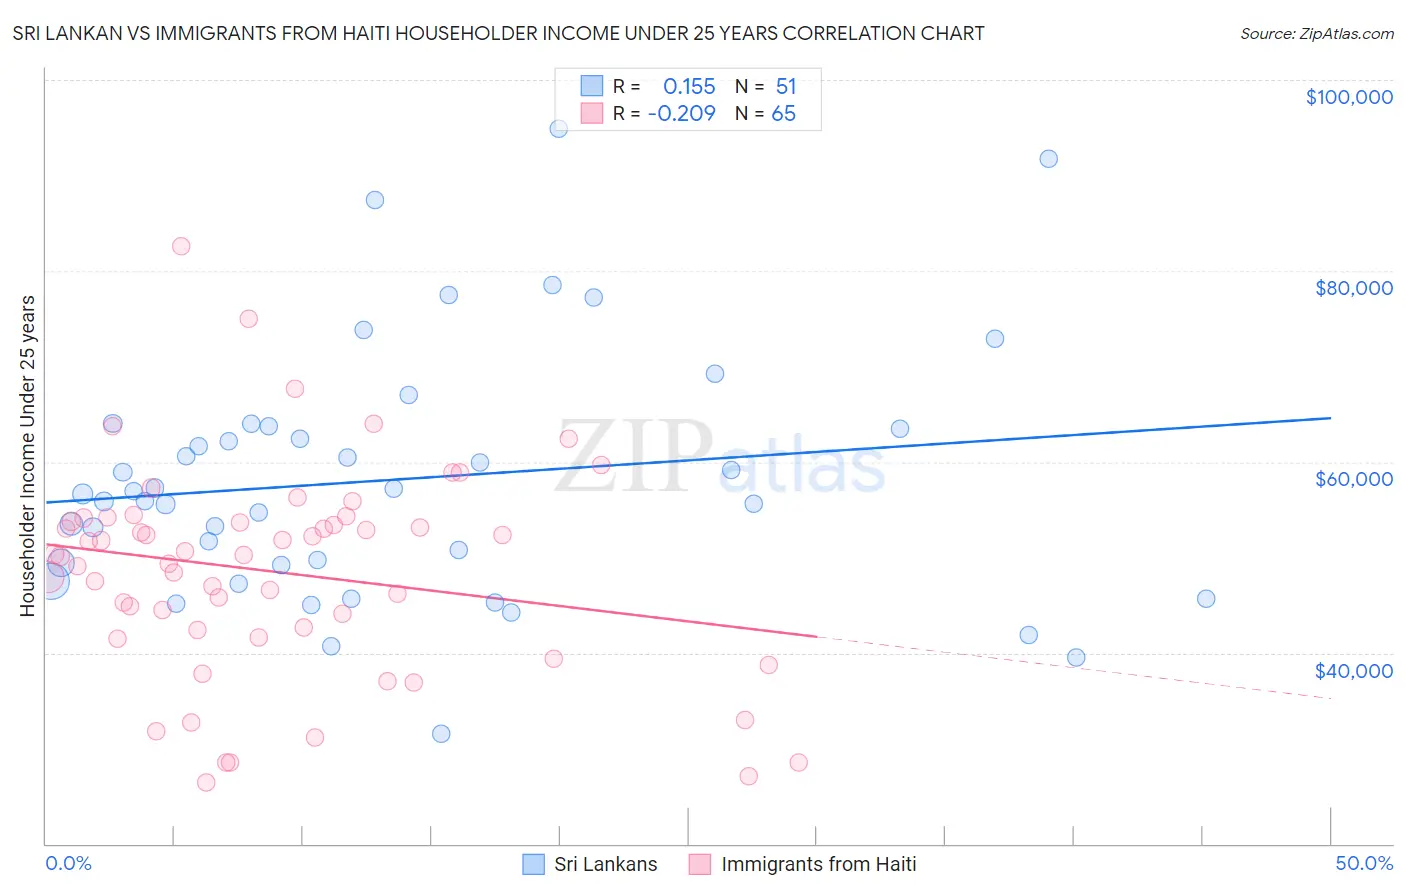
Sri Lankan vs Immigrants from Haiti Householder Income Under 25 years Correlation Chart
The statistical analysis conducted on geographies consisting of 370,884,989 people shows a poor positive correlation between the proportion of Sri Lankans and household income with householder under the age of 25 in the United States with a correlation coefficient (R) of 0.155 and weighted average of $55,470. Similarly, the statistical analysis conducted on geographies consisting of 194,658,893 people shows a weak negative correlation between the proportion of Immigrants from Haiti and household income with householder under the age of 25 in the United States with a correlation coefficient (R) of -0.209 and weighted average of $50,398, a difference of 10.1%.
Householder Income Under 25 years Correlation Summary
| Measurement | Sri Lankan | Immigrants from Haiti |
| Minimum | $31,569 | $26,470 |
| Maximum | $94,955 | $82,635 |
| Range | $63,386 | $56,166 |
| Mean | $58,171 | $48,468 |
| Median | $56,661 | $50,234 |
| Interquartile 25% (IQ1) | $49,199 | $41,992 |
| Interquartile 75% (IQ3) | $63,744 | $53,925 |
| Interquartile Range (IQR) | $14,546 | $11,932 |
| Standard Deviation (Sample) | $13,154 | $11,076 |
| Standard Deviation (Population) | $13,025 | $10,991 |
Similar Demographics by Householder Income Under 25 years
Demographics Similar to Sri Lankans by Householder Income Under 25 years
In terms of householder income under 25 years, the demographic groups most similar to Sri Lankans are Immigrants from Poland ($55,474, a difference of 0.010%), Immigrants from Ukraine ($55,447, a difference of 0.040%), Immigrants from Romania ($55,522, a difference of 0.090%), Immigrants from Indonesia ($55,521, a difference of 0.090%), and Salvadoran ($55,412, a difference of 0.10%).
| Demographics | Rating | Rank | Householder Income Under 25 years |
| Cambodians | 100.0 /100 | #47 | Exceptional $55,571 |
| Immigrants | Vietnam | 100.0 /100 | #48 | Exceptional $55,562 |
| Iranians | 100.0 /100 | #49 | Exceptional $55,548 |
| Puget Sound Salish | 100.0 /100 | #50 | Exceptional $55,543 |
| Immigrants | Romania | 100.0 /100 | #51 | Exceptional $55,522 |
| Immigrants | Indonesia | 100.0 /100 | #52 | Exceptional $55,521 |
| Immigrants | Poland | 100.0 /100 | #53 | Exceptional $55,474 |
| Sri Lankans | 100.0 /100 | #54 | Exceptional $55,470 |
| Immigrants | Ukraine | 100.0 /100 | #55 | Exceptional $55,447 |
| Salvadorans | 100.0 /100 | #56 | Exceptional $55,412 |
| Soviet Union | 100.0 /100 | #57 | Exceptional $55,340 |
| Guyanese | 99.9 /100 | #58 | Exceptional $55,210 |
| Native Hawaiians | 99.9 /100 | #59 | Exceptional $55,158 |
| Immigrants | Lithuania | 99.9 /100 | #60 | Exceptional $55,028 |
| Immigrants | Europe | 99.9 /100 | #61 | Exceptional $55,022 |
Demographics Similar to Immigrants from Haiti by Householder Income Under 25 years
In terms of householder income under 25 years, the demographic groups most similar to Immigrants from Haiti are Luxembourger ($50,379, a difference of 0.040%), Aleut ($50,377, a difference of 0.040%), Immigrants from Mexico ($50,422, a difference of 0.050%), Immigrants from Cuba ($50,374, a difference of 0.050%), and Lebanese ($50,355, a difference of 0.090%).
| Demographics | Rating | Rank | Householder Income Under 25 years |
| Welsh | 2.0 /100 | #246 | Tragic $50,597 |
| Immigrants | Bosnia and Herzegovina | 1.8 /100 | #247 | Tragic $50,565 |
| Slavs | 1.8 /100 | #248 | Tragic $50,563 |
| Scottish | 1.8 /100 | #249 | Tragic $50,554 |
| Immigrants | Cabo Verde | 1.7 /100 | #250 | Tragic $50,520 |
| Celtics | 1.4 /100 | #251 | Tragic $50,447 |
| Immigrants | Mexico | 1.3 /100 | #252 | Tragic $50,422 |
| Immigrants | Haiti | 1.2 /100 | #253 | Tragic $50,398 |
| Luxembourgers | 1.2 /100 | #254 | Tragic $50,379 |
| Aleuts | 1.2 /100 | #255 | Tragic $50,377 |
| Immigrants | Cuba | 1.2 /100 | #256 | Tragic $50,374 |
| Lebanese | 1.1 /100 | #257 | Tragic $50,355 |
| Whites/Caucasians | 1.1 /100 | #258 | Tragic $50,336 |
| Immigrants | Dominica | 1.0 /100 | #259 | Tragic $50,301 |
| Hispanics or Latinos | 0.9 /100 | #260 | Tragic $50,279 |