Sri Lankan vs Immigrants from Russia Householder Income Under 25 years
COMPARE
Sri Lankan
Immigrants from Russia
Householder Income Under 25 years
Householder Income Under 25 years Comparison
Sri Lankans
Immigrants from Russia
$55,470
HOUSEHOLDER INCOME UNDER 25 YEARS
100.0/ 100
METRIC RATING
54th/ 347
METRIC RANK
$55,891
HOUSEHOLDER INCOME UNDER 25 YEARS
100.0/ 100
METRIC RATING
37th/ 347
METRIC RANK
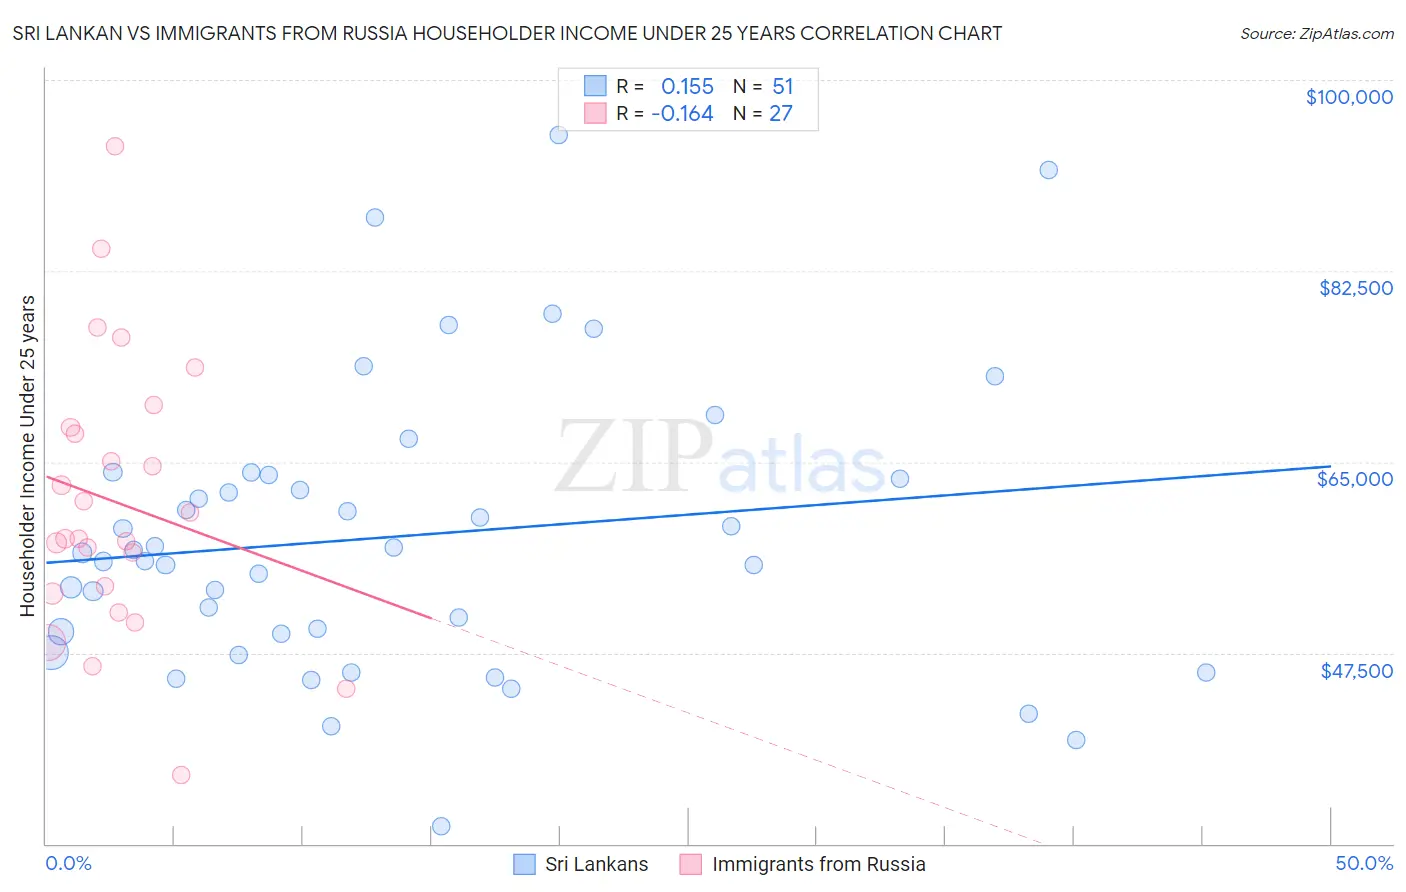
Sri Lankan vs Immigrants from Russia Householder Income Under 25 years Correlation Chart
The statistical analysis conducted on geographies consisting of 370,884,989 people shows a poor positive correlation between the proportion of Sri Lankans and household income with householder under the age of 25 in the United States with a correlation coefficient (R) of 0.155 and weighted average of $55,470. Similarly, the statistical analysis conducted on geographies consisting of 295,410,688 people shows a poor negative correlation between the proportion of Immigrants from Russia and household income with householder under the age of 25 in the United States with a correlation coefficient (R) of -0.164 and weighted average of $55,891, a difference of 0.76%.
Householder Income Under 25 years Correlation Summary
| Measurement | Sri Lankan | Immigrants from Russia |
| Minimum | $31,569 | $36,250 |
| Maximum | $94,955 | $93,974 |
| Range | $63,386 | $57,724 |
| Mean | $58,171 | $61,278 |
| Median | $56,661 | $57,969 |
| Interquartile 25% (IQ1) | $49,199 | $52,911 |
| Interquartile 75% (IQ3) | $63,744 | $68,185 |
| Interquartile Range (IQR) | $14,546 | $15,274 |
| Standard Deviation (Sample) | $13,154 | $12,683 |
| Standard Deviation (Population) | $13,025 | $12,446 |
Demographics Similar to Sri Lankans and Immigrants from Russia by Householder Income Under 25 years
In terms of householder income under 25 years, the demographic groups most similar to Sri Lankans are Immigrants from Poland ($55,474, a difference of 0.010%), Immigrants from Ukraine ($55,447, a difference of 0.040%), Immigrants from Romania ($55,522, a difference of 0.090%), Immigrants from Indonesia ($55,521, a difference of 0.090%), and Puget Sound Salish ($55,543, a difference of 0.13%). Similarly, the demographic groups most similar to Immigrants from Russia are Immigrants from Iran ($55,880, a difference of 0.020%), Tlingit-Haida ($55,914, a difference of 0.040%), Immigrants from Israel ($55,913, a difference of 0.040%), Immigrants from Belarus ($55,743, a difference of 0.27%), and Immigrants from Greece ($55,727, a difference of 0.30%).
| Demographics | Rating | Rank | Householder Income Under 25 years |
| Tlingit-Haida | 100.0 /100 | #35 | Exceptional $55,914 |
| Immigrants | Israel | 100.0 /100 | #36 | Exceptional $55,913 |
| Immigrants | Russia | 100.0 /100 | #37 | Exceptional $55,891 |
| Immigrants | Iran | 100.0 /100 | #38 | Exceptional $55,880 |
| Immigrants | Belarus | 100.0 /100 | #39 | Exceptional $55,743 |
| Immigrants | Greece | 100.0 /100 | #40 | Exceptional $55,727 |
| Immigrants | Guyana | 100.0 /100 | #41 | Exceptional $55,726 |
| Immigrants | Korea | 100.0 /100 | #42 | Exceptional $55,716 |
| Immigrants | South Eastern Asia | 100.0 /100 | #43 | Exceptional $55,714 |
| Paraguayans | 100.0 /100 | #44 | Exceptional $55,614 |
| Spanish American Indians | 100.0 /100 | #45 | Exceptional $55,573 |
| Immigrants | Eastern Europe | 100.0 /100 | #46 | Exceptional $55,572 |
| Cambodians | 100.0 /100 | #47 | Exceptional $55,571 |
| Immigrants | Vietnam | 100.0 /100 | #48 | Exceptional $55,562 |
| Iranians | 100.0 /100 | #49 | Exceptional $55,548 |
| Puget Sound Salish | 100.0 /100 | #50 | Exceptional $55,543 |
| Immigrants | Romania | 100.0 /100 | #51 | Exceptional $55,522 |
| Immigrants | Indonesia | 100.0 /100 | #52 | Exceptional $55,521 |
| Immigrants | Poland | 100.0 /100 | #53 | Exceptional $55,474 |
| Sri Lankans | 100.0 /100 | #54 | Exceptional $55,470 |
| Immigrants | Ukraine | 100.0 /100 | #55 | Exceptional $55,447 |