Czechoslovakian vs Venezuelan Householder Income Under 25 years
COMPARE
Czechoslovakian
Venezuelan
Householder Income Under 25 years
Householder Income Under 25 years Comparison
Czechoslovakians
Venezuelans
$51,224
HOUSEHOLDER INCOME UNDER 25 YEARS
8.6/ 100
METRIC RATING
217th/ 347
METRIC RANK
$50,011
HOUSEHOLDER INCOME UNDER 25 YEARS
0.5/ 100
METRIC RATING
268th/ 347
METRIC RANK
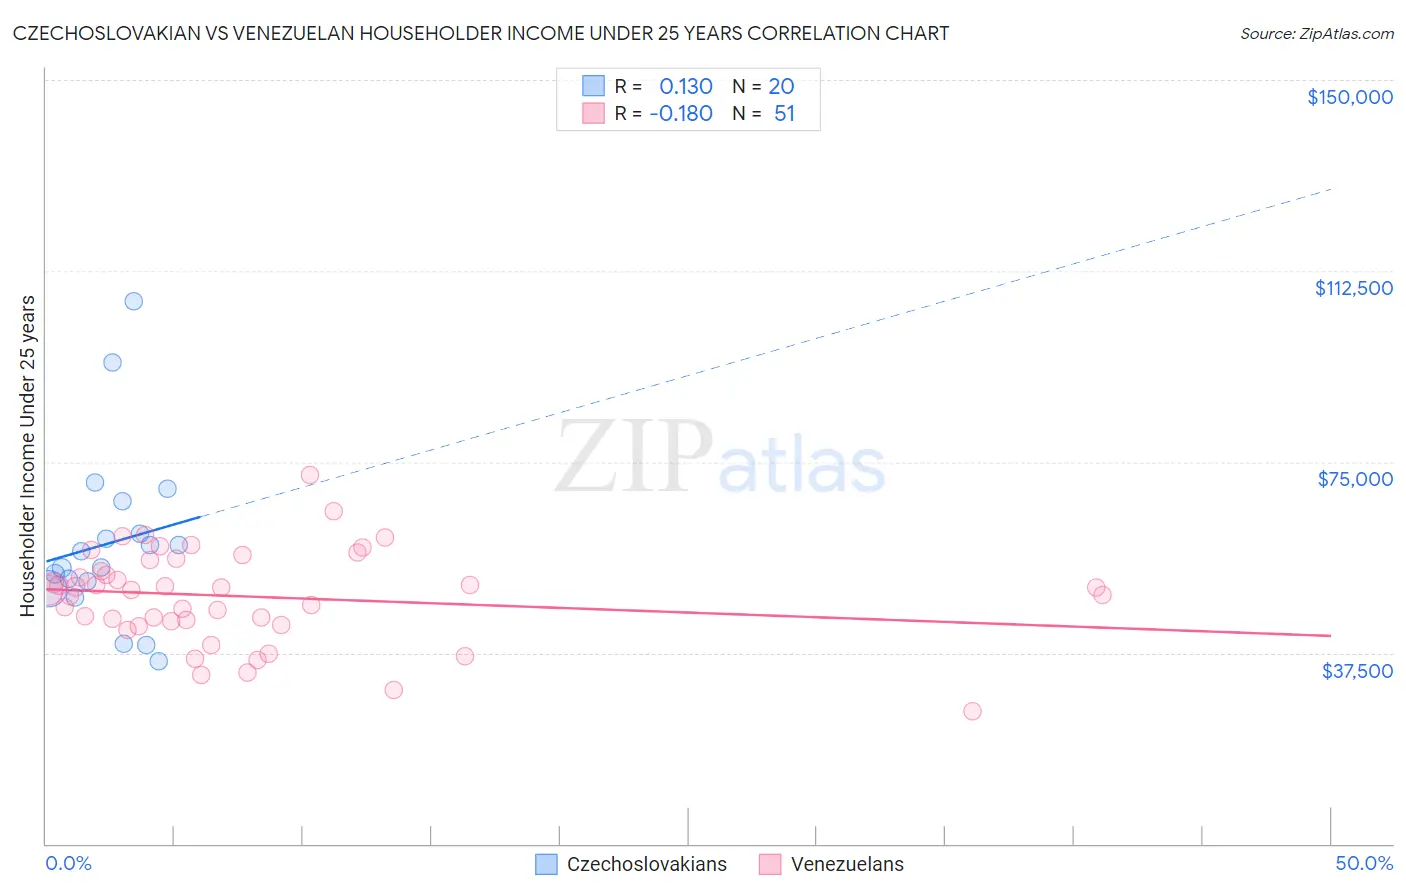
Czechoslovakian vs Venezuelan Householder Income Under 25 years Correlation Chart
The statistical analysis conducted on geographies consisting of 311,218,514 people shows a poor positive correlation between the proportion of Czechoslovakians and household income with householder under the age of 25 in the United States with a correlation coefficient (R) of 0.130 and weighted average of $51,224. Similarly, the statistical analysis conducted on geographies consisting of 267,458,275 people shows a poor negative correlation between the proportion of Venezuelans and household income with householder under the age of 25 in the United States with a correlation coefficient (R) of -0.180 and weighted average of $50,011, a difference of 2.4%.
Householder Income Under 25 years Correlation Summary
| Measurement | Czechoslovakian | Venezuelan |
| Minimum | $35,781 | $26,011 |
| Maximum | $106,448 | $72,500 |
| Range | $70,667 | $46,489 |
| Mean | $59,100 | $48,579 |
| Median | $55,865 | $49,832 |
| Interquartile 25% (IQ1) | $50,876 | $43,664 |
| Interquartile 75% (IQ3) | $64,106 | $55,823 |
| Interquartile Range (IQR) | $13,231 | $12,159 |
| Standard Deviation (Sample) | $17,072 | $9,174 |
| Standard Deviation (Population) | $16,639 | $9,084 |
Similar Demographics by Householder Income Under 25 years
Demographics Similar to Czechoslovakians by Householder Income Under 25 years
In terms of householder income under 25 years, the demographic groups most similar to Czechoslovakians are Immigrants from Belize ($51,223, a difference of 0.0%), French ($51,230, a difference of 0.010%), Arab ($51,219, a difference of 0.010%), Icelander ($51,247, a difference of 0.050%), and Zimbabwean ($51,259, a difference of 0.070%).
| Demographics | Rating | Rank | Householder Income Under 25 years |
| Immigrants | Ghana | 10.9 /100 | #210 | Poor $51,333 |
| Irish | 10.6 /100 | #211 | Poor $51,317 |
| Immigrants | Panama | 9.7 /100 | #212 | Tragic $51,278 |
| Dutch | 9.4 /100 | #213 | Tragic $51,265 |
| Zimbabweans | 9.3 /100 | #214 | Tragic $51,259 |
| Icelanders | 9.1 /100 | #215 | Tragic $51,247 |
| French | 8.7 /100 | #216 | Tragic $51,230 |
| Czechoslovakians | 8.6 /100 | #217 | Tragic $51,224 |
| Immigrants | Belize | 8.6 /100 | #218 | Tragic $51,223 |
| Arabs | 8.5 /100 | #219 | Tragic $51,219 |
| Immigrants | Germany | 8.0 /100 | #220 | Tragic $51,190 |
| Immigrants | Eastern Africa | 7.4 /100 | #221 | Tragic $51,158 |
| Spaniards | 6.8 /100 | #222 | Tragic $51,117 |
| Serbians | 6.6 /100 | #223 | Tragic $51,106 |
| Belizeans | 6.4 /100 | #224 | Tragic $51,094 |
Demographics Similar to Venezuelans by Householder Income Under 25 years
In terms of householder income under 25 years, the demographic groups most similar to Venezuelans are Ute ($49,997, a difference of 0.030%), Mexican ($49,989, a difference of 0.040%), Immigrants from Laos ($50,041, a difference of 0.060%), Immigrants from Venezuela ($50,109, a difference of 0.19%), and Belgian ($50,113, a difference of 0.20%).
| Demographics | Rating | Rank | Householder Income Under 25 years |
| Hungarians | 0.9 /100 | #261 | Tragic $50,247 |
| Haitians | 0.8 /100 | #262 | Tragic $50,231 |
| Immigrants | Dominican Republic | 0.8 /100 | #263 | Tragic $50,204 |
| Fijians | 0.6 /100 | #264 | Tragic $50,132 |
| Belgians | 0.6 /100 | #265 | Tragic $50,113 |
| Immigrants | Venezuela | 0.6 /100 | #266 | Tragic $50,109 |
| Immigrants | Laos | 0.5 /100 | #267 | Tragic $50,041 |
| Venezuelans | 0.5 /100 | #268 | Tragic $50,011 |
| Ute | 0.5 /100 | #269 | Tragic $49,997 |
| Mexicans | 0.5 /100 | #270 | Tragic $49,989 |
| Taiwanese | 0.3 /100 | #271 | Tragic $49,804 |
| Colville | 0.3 /100 | #272 | Tragic $49,774 |
| Slovaks | 0.3 /100 | #273 | Tragic $49,753 |
| Immigrants | Senegal | 0.3 /100 | #274 | Tragic $49,742 |
| Immigrants | Kenya | 0.2 /100 | #275 | Tragic $49,633 |